High Server Load
Its often seen that many times your server comes under high load and at some stage you are not even able to access shell or WHM panel. So the only option left is to reboot the server and once the server comes up the load comes normal leaving you wondering what was causing high load. Today i am going to show you some of the ways on how to trouble shoot and anaylze the
high load problem.
You need to be cautious and start analyzing the timing when the server load shoots up, Is it going high at any particular time ? Or was any account recently setup on the server ? Precisely excessive usage of any of the following can cause high load on the server.
High CPU Process
High RAM Process
High Disk I/O
System administrators have very handy tools which they can use to trouble shoot any issues. One of this is the most important tool called “SAR” , So what is SAR ? ( System Activity Reporter ) is a very handy tool that helps system administrator to get the status of machine with different metrics at different point of time. One of metrics that we will discuss is getting CPU utilization and process report of the system.
SAR Command Features
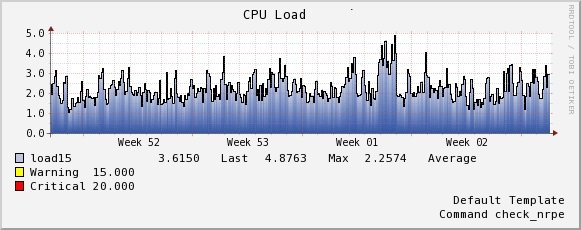
This reports the run queue size and load average of last 1 minute, 5 minutes, and 15 minutes so you able to identify at what time the load was high.
root@server [~]# sar -q

Linux 3.10.0-123.el7.x86_64 (server ) 01/19/2016 _x86_64_ (8 CPU)
12:00:01 AM runq-sz plist-sz ldavg-1 ldavg-5 ldavg-15 blocked
12:10:01 AM 3 296 0.08 0.18 0.21 0
12:20:01 AM 4 301 0.22 0.18 0.21 1
12:30:01 AM 4 295 0.23 0.22 0.23 1
12:40:01 AM 3 294 0.67 0.38 0.28 0
12:50:01 AM 2 301 0.20 0.18 0.22 1
01:00:01 AM 4 304 0.19 0.22 0.23 1
01:10:01 AM 3 307 0.06 0.22 0.27 0
01:20:01 AM 3 295 0.31 0.25 0.25 1
01:30:01 AM 3 296 0.34 0.49 0.38 1
01:40:01 AM 2 289 0.11 0.20 0.29 1
01:50:01 AM 3 299 0.62 0.41 0.35 0
Following are few variations that you can select depending upon your needs.
sar -q

sar -q 1 3

sar -q -f /var/log/sa/sa10
Fetching historical metrics using sar for a particular day. If i want to know metrics for 27th day of the month, It can be done as shown below.
 root@server [~]# sar -f /var/log/sa/sa27

Linux 3.10.0-123.el7.x86_64 (server) 12/27/2015 _x86_64_ (8 CPU)
12:00:01 AM CPU %user %nice %system %iowait %steal %idle
12:10:01 AM all 3.83 0.00 1.03 0.28 0.00 94.85
12:20:01 AM all 6.37 0.03 0.74 3.00 0.00 89.86
12:30:02 AM all 0.67 0.01 0.77 7.04 0.00 91.51
12:40:01 AM all 0.14 0.01 0.53 12.52 0.00 86.80
12:50:01 AM all 0.13 0.01 0.46 12.25 0.00 87.14
01:00:02 AM all 0.20 0.05 1.11 13.03 0.00 85.61
01:10:01 AM all 1.50 0.11 0.62 4.42 0.00 93.36
01:20:01 AM all 7.46 0.00 2.36 1.18 0.00 89.00
01:30:01 AM all 0.89 0.00 0.56 0.30 0.00 98.25
You can again use few variations with the command line for finding out the load average
Analyzing the Current CPU usage on the server.
For Checking CPU usage the best tool is top command, from the command line execute “top” command and on the line that says “Cpu(s)”, check the “%id” section which shows the percentage of which your CPUs are idle. The higher the number the better. A 99% idle CPU is not doing much of anything, and 1% idle CPU is heavily tasked. check the “task” total running on the server as well. If you see higher number then you need analyze it deeply with ps -aufx command.
root@server [~]# top c

hit "P" to sort by processes that are currently consuming the most CPU.
Analyzing High Memory usage process on the server.
Use the following command for sorting down processes by its memory usage. Here you can see Clamd is using high memory followed by mysql. You need to keep a constant check as it may have variations. So a decent observation will be required.
root@server [~]# ps aux --sort -rss

USER PID %CPU %MEM VSZ RSS TTY STAT START TIME COMMAND

root 31851 0.0 4.1 706784 330804 ? Ssl 2015 12:17 /usr/local/cpanel/3rdparty/bin/clamd

mysql 8023 1.5 2.3 1894688 190772 ? Sl Jan05 307:01 /usr/sbin/mysqld --basedir=/usr --datadir=/var/lib/mysql --plugin-dir=/usr/lib64/mysql/plugin --log-error=/var/lib/mysql/server.com.err --open-files-limit=10000 --pid-file=/var/lib/mys

root 7460 0.1 1.7 287528 136816 ? S Jan19 1:18 spamd child

named 4237 0.0 1.4 683664 117672 ? Ssl 2015 18:27 /usr/sbin/named -u named

root 31931 0.0 0.8 221400 68828 ? S Jan19 0:00 spamd child

root 8733 0.0 0.3 204648 28412 ? Ss 2015 4:01 /usr/local/cpanel/3rdparty/perl/514/bin/spamd --daemonize --allowed-ips=127.0.0.1 --max-children=5 --pidfile=/var/run/spamd.pid -i127.0.0.1

root 14354 0.0 0.3 241432 28272 ? S Jan18 0:00 cpdavd - accepting connections on 2077, 2078, 2079, and 2080

root 2878 0.0 0.3 111188 28136 ? S 2015 0:35 cpsrvd (SSL) - waiting f --llu=1453100091 --listen=10,11,4,5,6,7,8,9

root 439 0.0 0.3 74120 26604 ? Ss 2015 4:56 /usr/lib/systemd/systemd-journald

root 15099 0.0 0.2 177668 21700 ? Ss Jan18 0:27 lfd - sleeping

root 14185 0.0 0.2 88792 16820 ? S Jan18 0:12 tailwatchd
Following are few variations for ps command
A quick method to pipe the output of ps aux to the sort command.
$ ps aux | sort -rn -k 5,6
An additional tip would be to pipe the entire output to another command such as less. This allows you to look at the information a page at a time and also use the arrow keys and page up/down keys to scroll back and forth
through the output.
$ ps aux | sort -rn -k 5,6 | less
Analyzing High Disk Usage on the server.
root@server [~]# iotop

Total DISK READ : 0.00 B/s | Total DISK WRITE : 23.54 K/s

Actual DISK READ: 0.00 B/s | Actual DISK WRITE: 0.00 B/s
Disk I/O
root@server [~]# iostat -x 1 10
This will print the disk usage statistics 10 times, every 1 seconds. Check the %util column:
The main reason for this is to see what’s taking place on the server while the load is high. Instant actions will let you to troubleshoot the issue while it is occurring. Happy Troubleshooting 🙂