Best Linux server performance tools – top, atop and iotop
Monitoring server’s performance is today well known topic being discussed around the world and the idea behind monitoring server’s performance is to check the servers Stability, Performance Speed and Scalability. The information collected with various monitoring tools helps to identify and detect potential resource usage like CPU Usage, RAM usage and Disk I/O usage. Today i am going to show you some different and important Linux server performance tools like top, atop and iotop which are similar in many ways but have different unique method to provide statistical information.
TOP
 The top command is very basic tool with real-time view of processes that are running. Top command displays system summary information and list of processes running along with CPU percentage, memory percentage, execution time and complete path of the running process.
Top command also provides interactive interface for process manipulation for example. Pressing “m” for memory display and much more interface for personal configurations.
Some Useful Commands
Specific user process
top -u username
Delay time between refreshing the screen
top -d2
Processes with specified process IDs
top -p pid
Showing command and program name
top -c
Interactive Command example.
Example .1)
After running top command pressing ‘1’ will display the load information about individual CPU cores.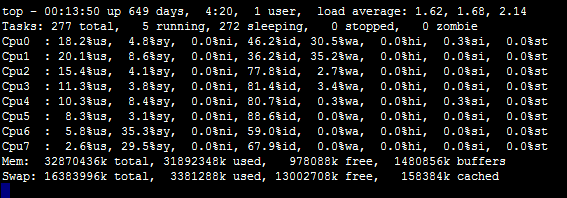
Example .2)
Below command is used to shows the CPU usage at intervals of 1 second.
[root@server1 home]# top -d 1.0 -b | grep CPU
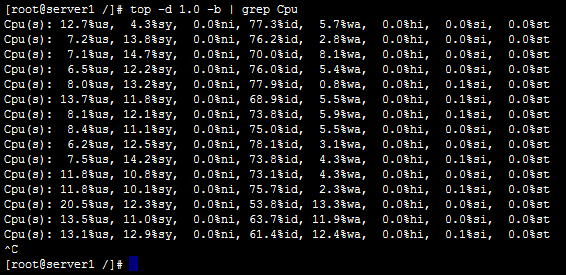 [root@server1 home]#
Press ctrl+c to stop the command.
ATOP
 The atop command is one step ahead and provides interactive monitoring view to load, cpu, memory, disk and network usages. atop is also known as ASCII full-screen performance monitoring tool which can log and report the activities of all server processes. From performance point of view this tool helps a lot to analyze and evaluate your systems performance. It provides critical information about which processes are responsible for the indicated load with respect to cpu and memory load on process level.
Some Useful Commands
Launch with active processes only:
atop -a
Launch with command line per process
atop -c
Launch with disk info
atop -d
Launch with memory info
atop -m
Launch with network info
atop -n
Once atop is running, press the following shortcut keys.
a – sort in order of most active resource.
c – revert to sorting by cpu consumption (default).
d – sort in order of disk activity.
m – sort in order of memory usage
n – sort in order of network activity
IOTOP 
The iotop is again a similar open source monitoring tool like top but specifically a disk monitoring utility tool. Its known as Input/Output monitoring tool for your hard disk to check DISK read and DISK write performance. This tool helps us to understand if there is any specific problem with disk when you see sluggish performance or high load on the server.
Some Useful Commands
Show processes or threads only doing I/O
iotop -o
Show user specific doing I/O
iotop -u username
Show kilobytes instead of a human friendly unitiotop -k
Conclusion. All the above commands are tested and safe to use. Top tool is installed by default on any Linux operation system. The other two tool atop and iotop may not be installed by default , hence you need to install it using the yum command which is very simple.