 Business analysts or managers often need to take some meaningful business decisions to monitor the growth of their organization and achieve higher profits. Before taking strategic decisions, it is important to analyze the data gathered from disparate sources; for example, OLTP (Online Transaction Processing) systems. In an OLTP, multiple transactions are processed in real time. For example, when you place an online order, you provide your credit card details. If the details are valid, money is transferred from your bank account to the reseller’s account; your bank account is updated. A receipt or an order tracking number is generated for your reference. A large volume of data, probably few terabytes, gets generated through the product purchasing by many customers like us. As I said, all this happens in a real time.
However, the raw data obtained by querying an OLTP system is not that useful for business intelligence.
Complex questions such as what are the Total sales for product line Cosmetics per store per month for last 2 years across Texas? Further, what item from the same product line grossing higher revenues for the specified date range and geographical area? cannot be answered using OLTP systems.
To answer above questions OLAP (Online Analytical Processing) systems are the best options. OLAP systems support multidimensional analysis. It means, ability to see the data using multiple filters or dimensions.
An OLAP cube is a data source with many dimensions and can be used to analyze the data in a flexible, user-friendly way.
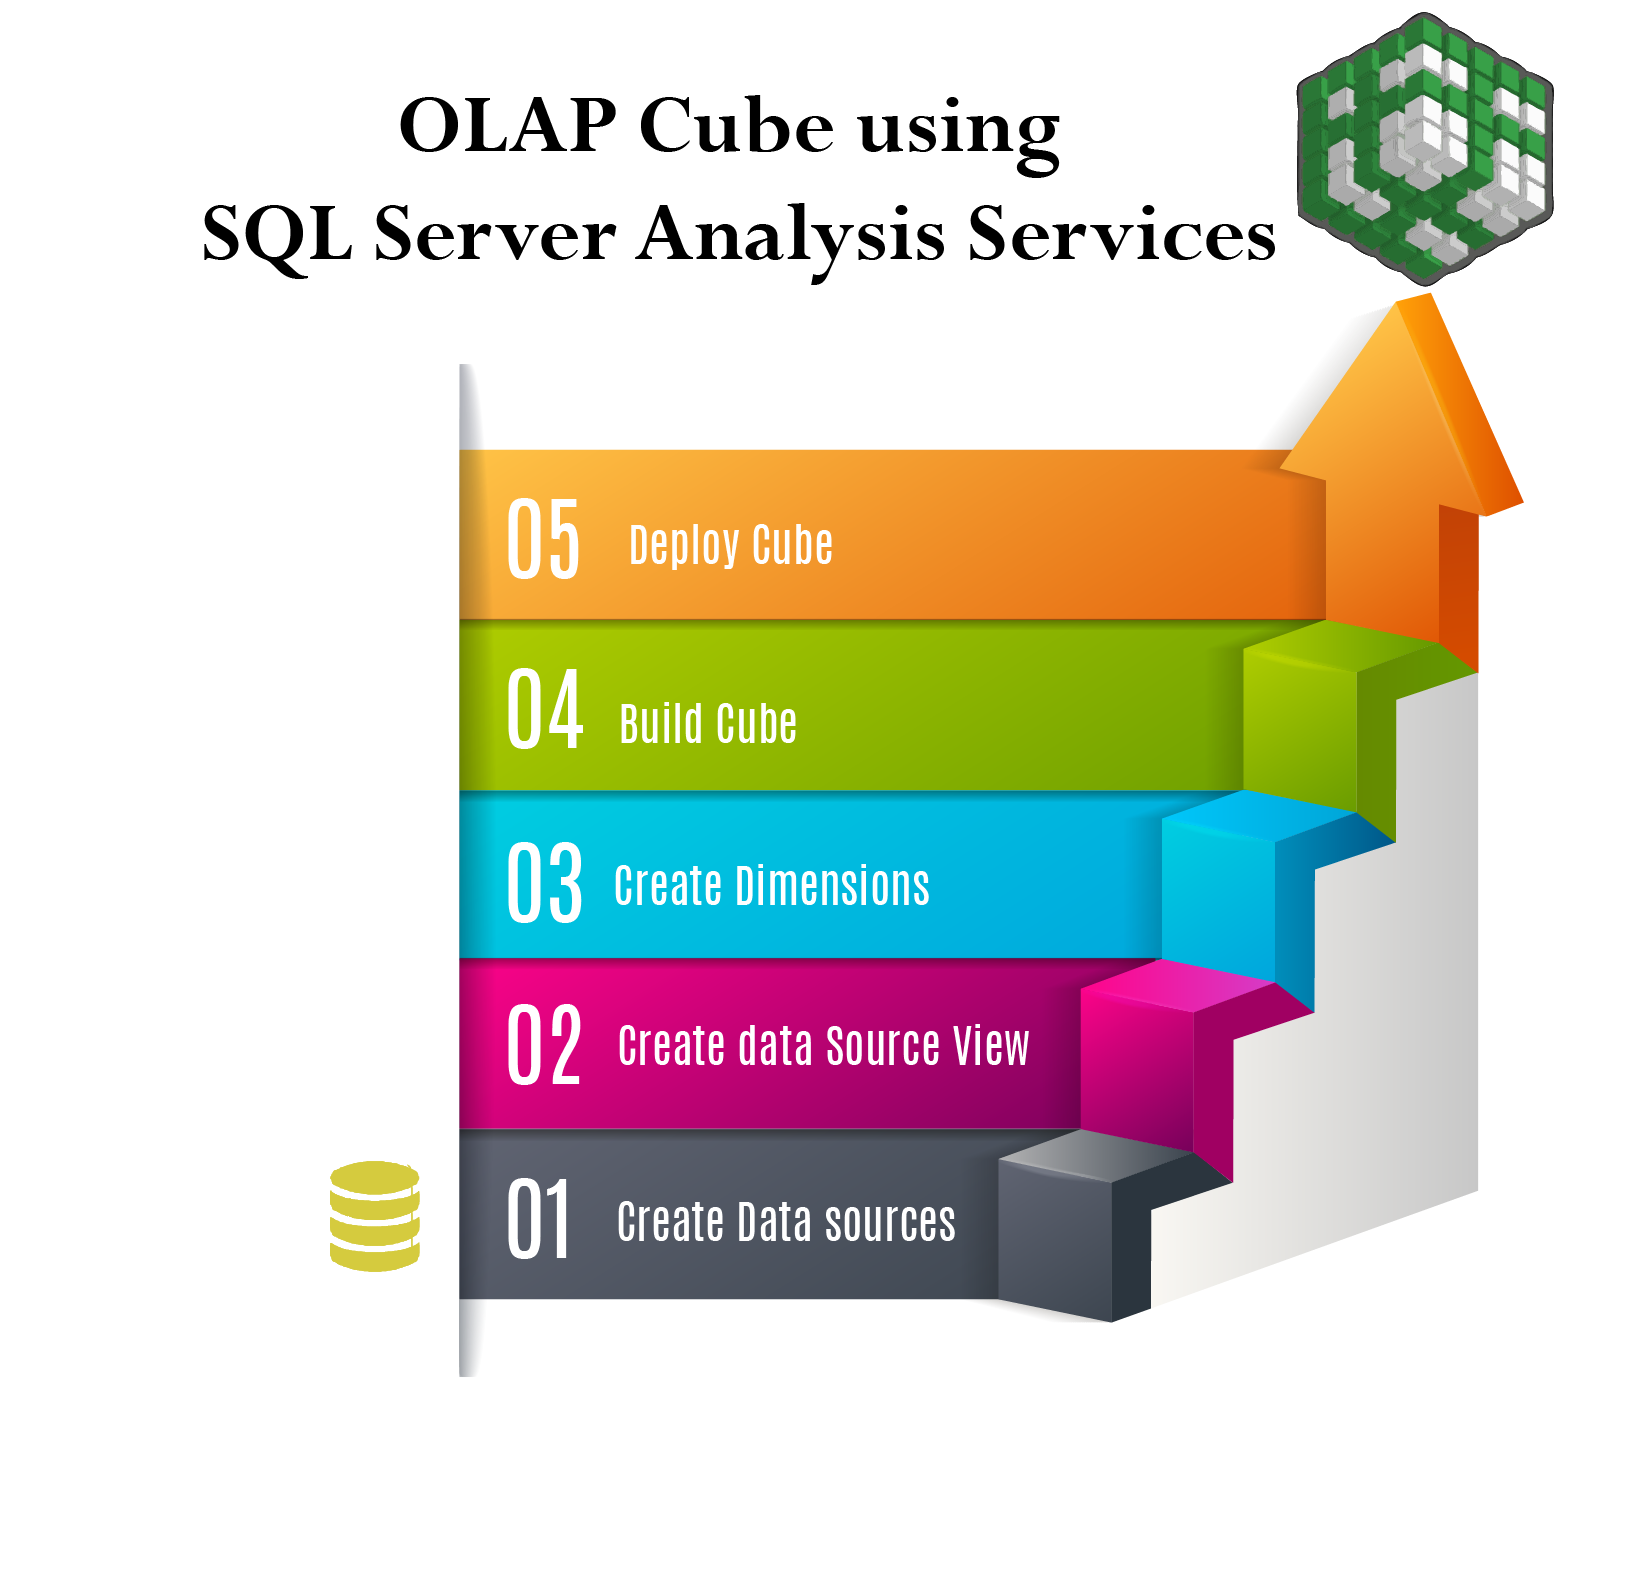
This tutorial will take you through the steps to build a cube using analysis services component of SQL server 2012 – Enterprise edition. (Note : SSAS is also available in Standard edition, however it is absent in Express edition.)
a) Create an Analysis Services Project
Click Start; go to All programs –> Microsoft SQL server 2012 –> SQL server Data Tools
Click on the New Project link, blue in color, on the left pane of the Start Page.
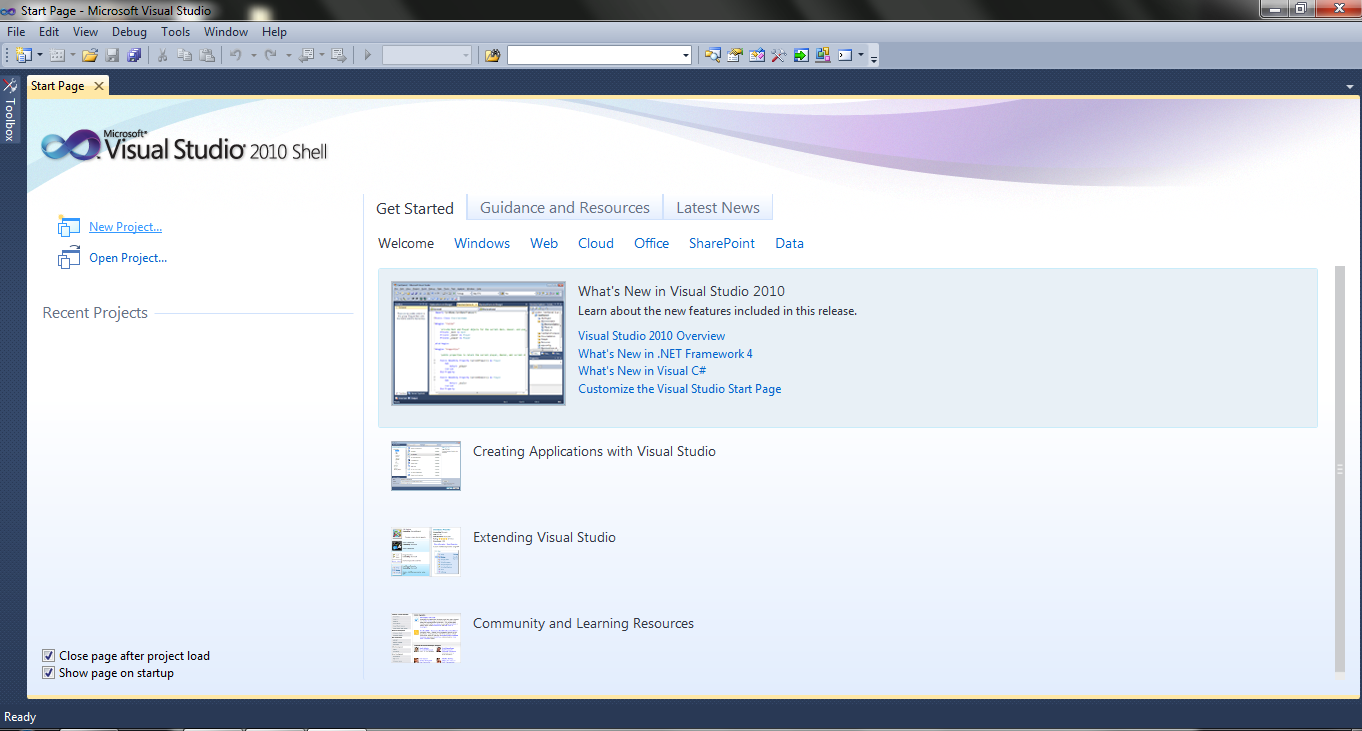
It will open a ‘New Project’ dialog box as shown below.
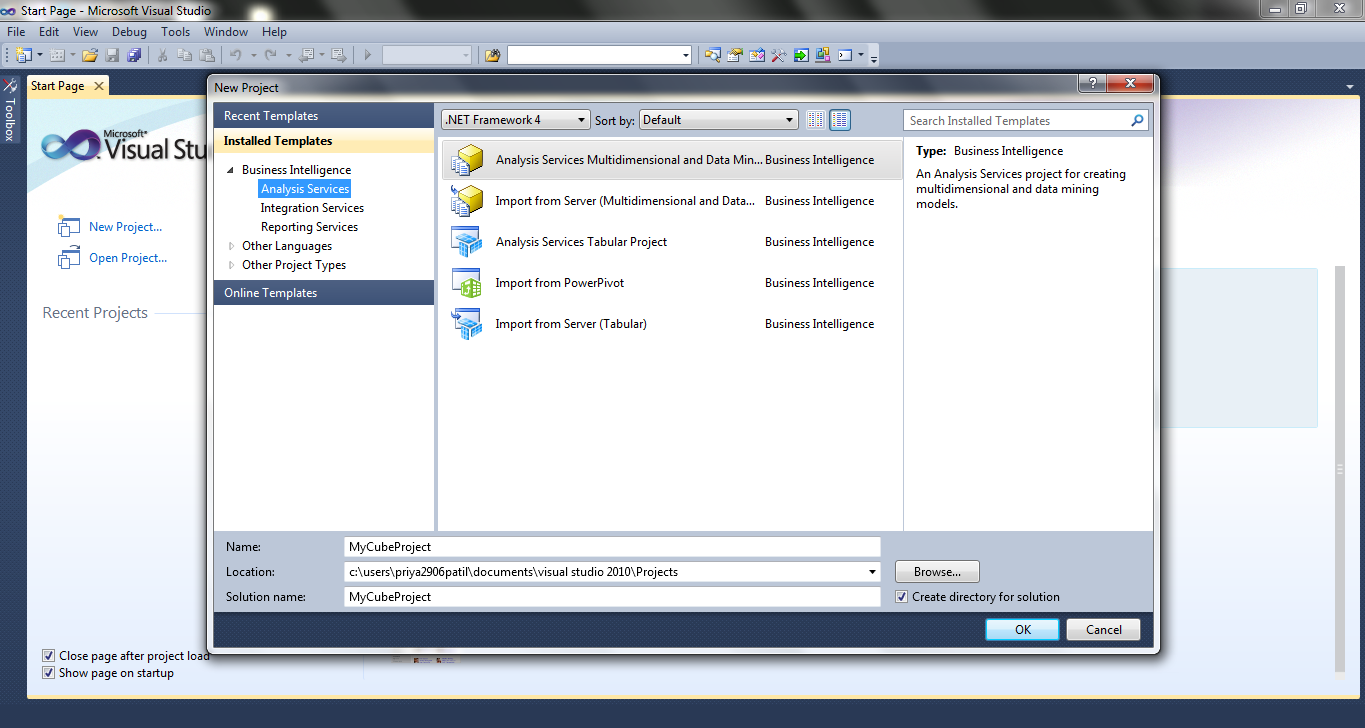
In the box, in the Installed Templates pane on the left, expand the Business Intelligence pane to select Analysis Services. Choose the Analysis Services Multidimensional and Data Mining Project template. If you want, you can change the default project name to something that you can remember easily. Project name change reflects the change in the Solution name text box to match the project name. Path in the location text box is a path of the directory created for the solution. Let me change the default project name MultidimensionalProject1 to MyCubeProject. Click OK.
You will see the default layout with the Solution explorer and Properties window one below the other on the right hand side. If you do not see Solution Explorer and/or Properties window, go to View on the toolbar, and select windows you want to show/hide.
b) Create Data Source(s)
Right Click on the data sources folder under the MyCubeProject solution, click New Data Source
It opens a Welcome page of the Data Source Wizard.
Click Next button on the welcome page. Select how to define a connection page gets opened.
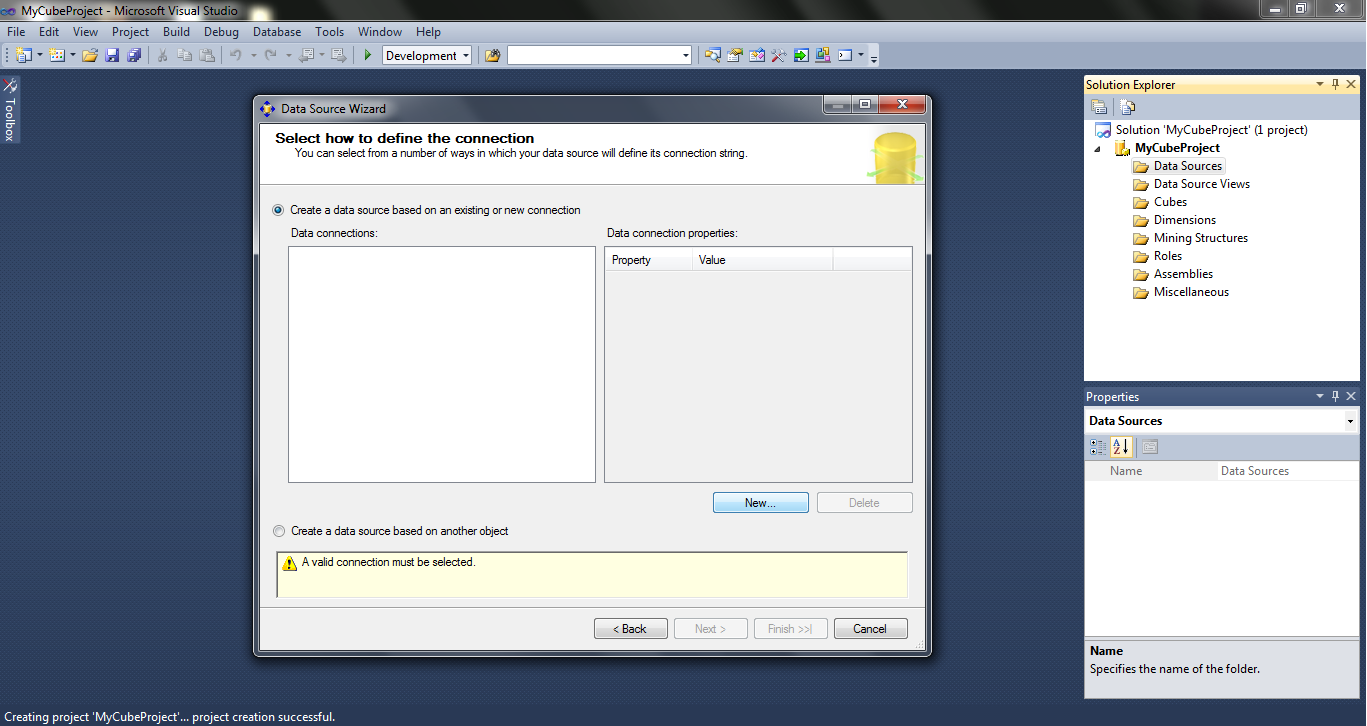
If a connection string to a local database is already listed in the Data Connections box, go ahead and click Next; If not, Select the New button to create a data source based on a new connection.
In the Connection manager dialog box, Select provider through Provider drop down list, select the server name, use either Windows or SQL authentication to log on to the server, and enter a database name. In my case, the database name is AdventureWorksDW2012.
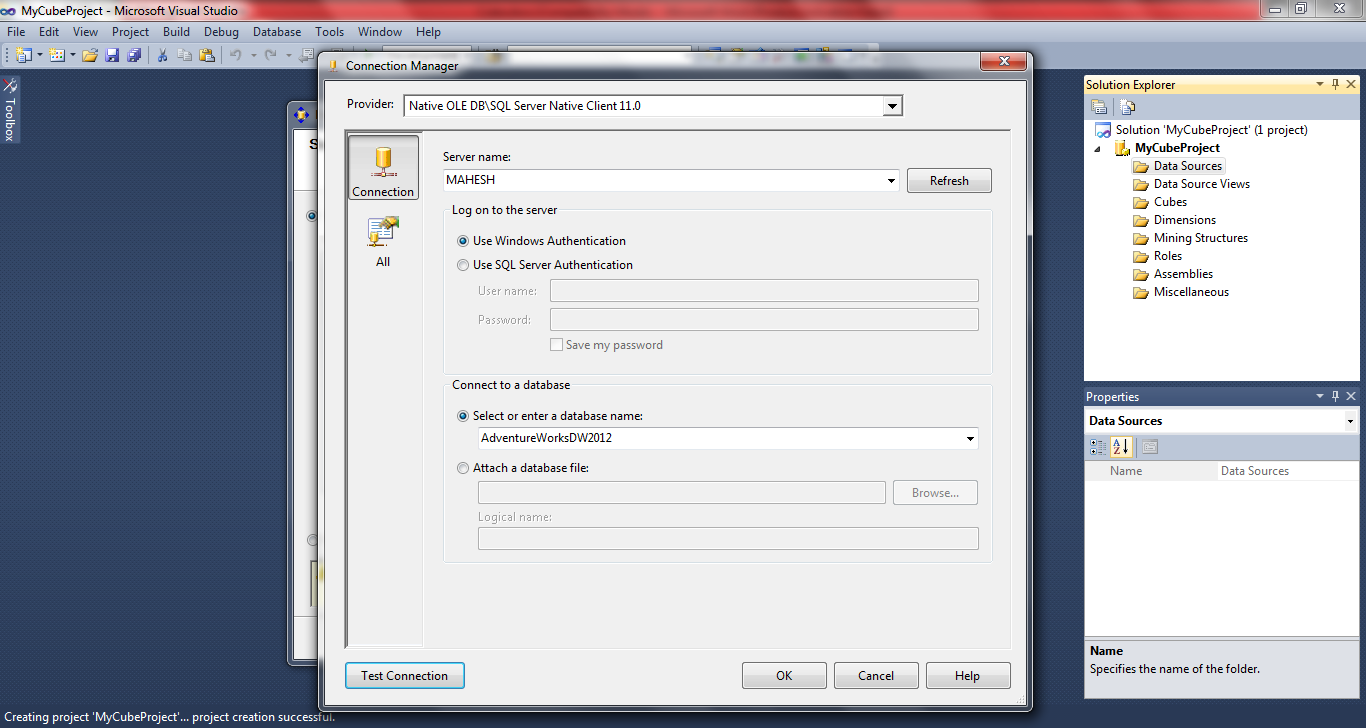
Click on the Test Connection button.
A message box pops up on your screen with a message – Test connection succeeded, provided you specified correct values. Click OK to close it.
Click OK to close the Connection manager dialog box after the test connection succeeds. Now, a connection string appears in the Data connections pane of Select how to define a connection page.
Click Next; Impersonation Information page opens.
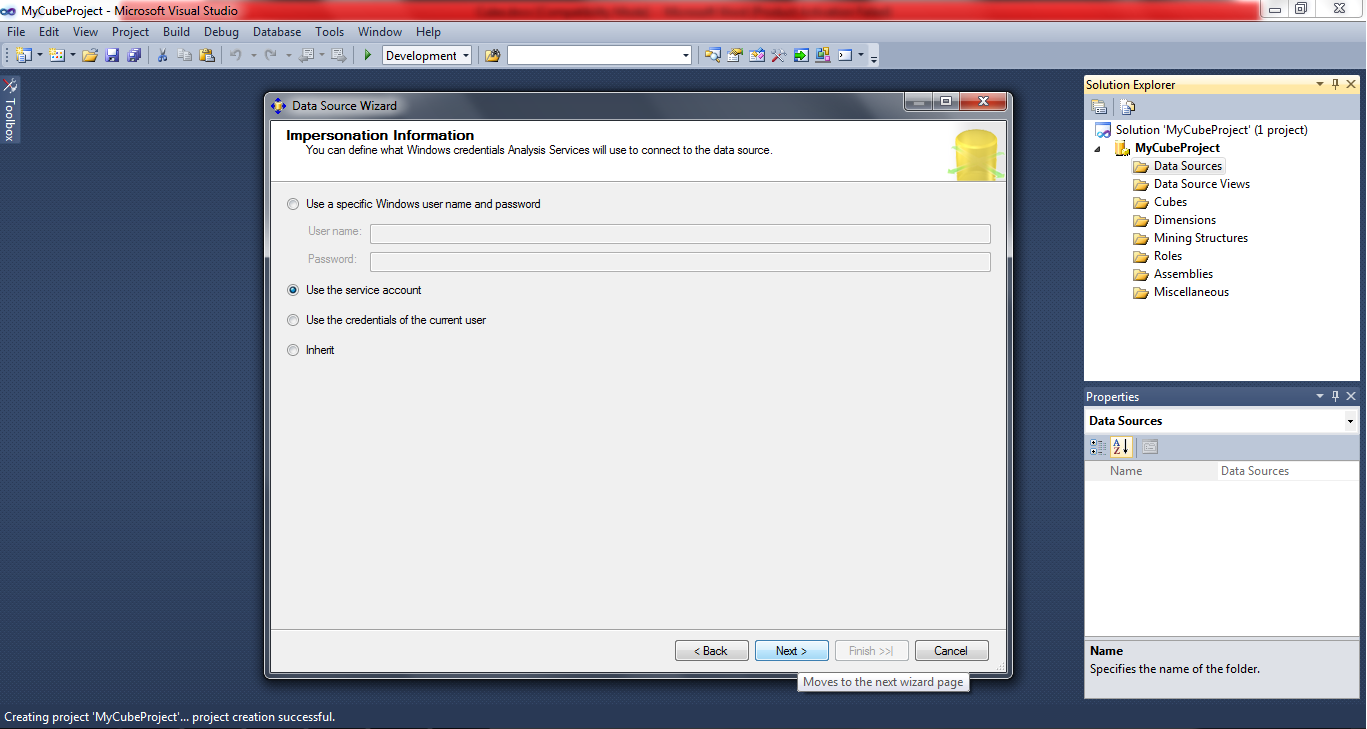
Select one of the options as per your preference and click Next.
Edit the data source name if you want, and click Finish to close the wizard.
You can see the data source we just created- MyAdvenWorksDW2012 in the solution explorer after you expand Data Sources menu. This way, we can create one or more data sources into this project as per the requirements. For now, let’s proceed with this one only.
c) Create Data Source View
Right Click on the Data Source Views folder under the MyCubeProject solution, click New Data Source,
It will open a Welcome page of Data Source View Wizard.
Click Next, it opens a page called Select Data Source.
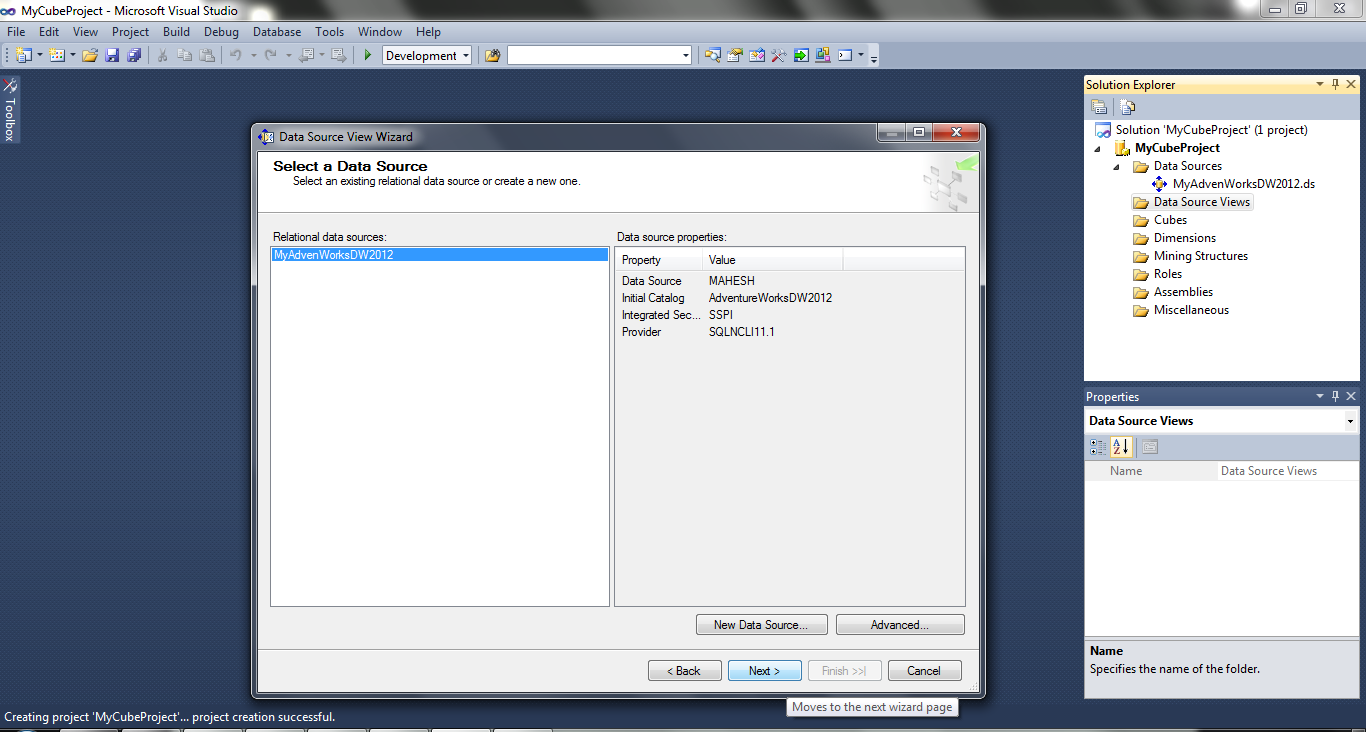
If you haven’t created data source(s) or you want to add to the existing one(s), click on New Data Source button and follow the Data Source Wizard. Select the data source(s) and click Next.
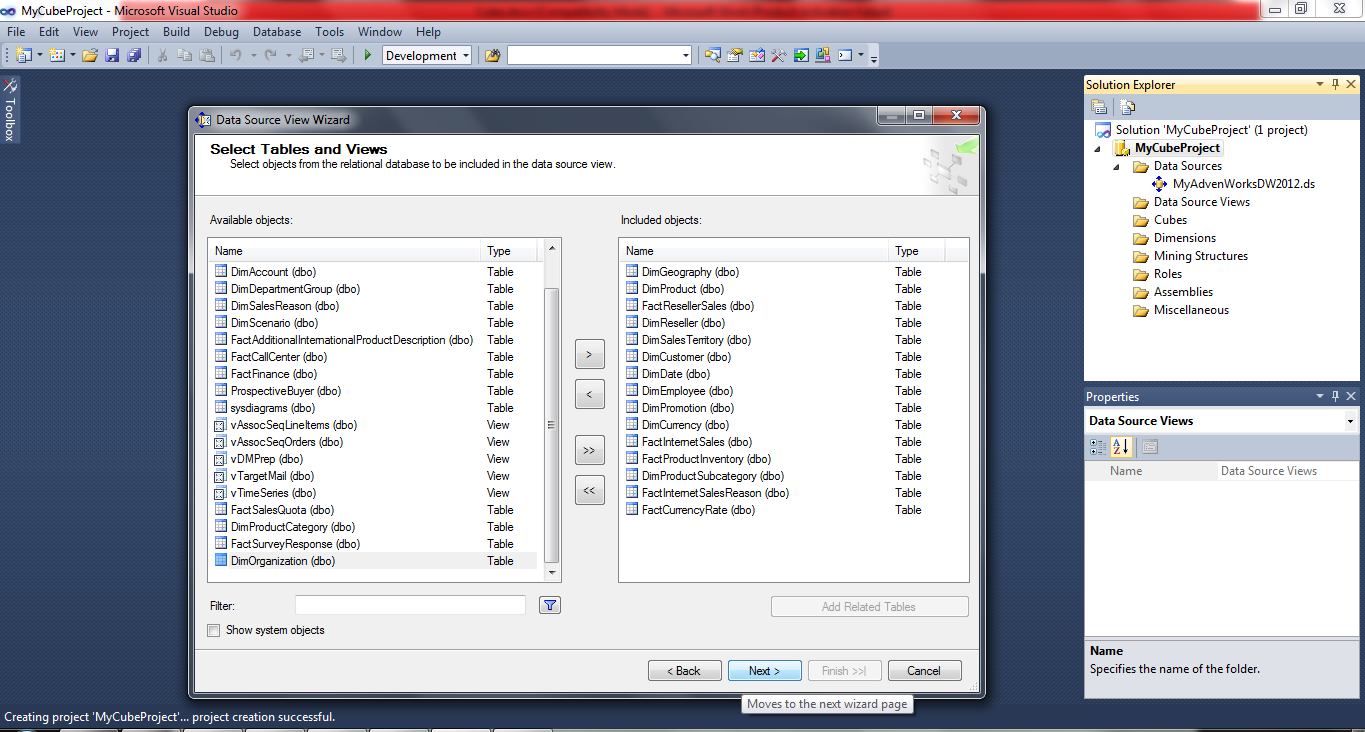
On the Select Tables and Views page, pick up the objects you are interested in, move to the included objects box by clicking a right arrow button.
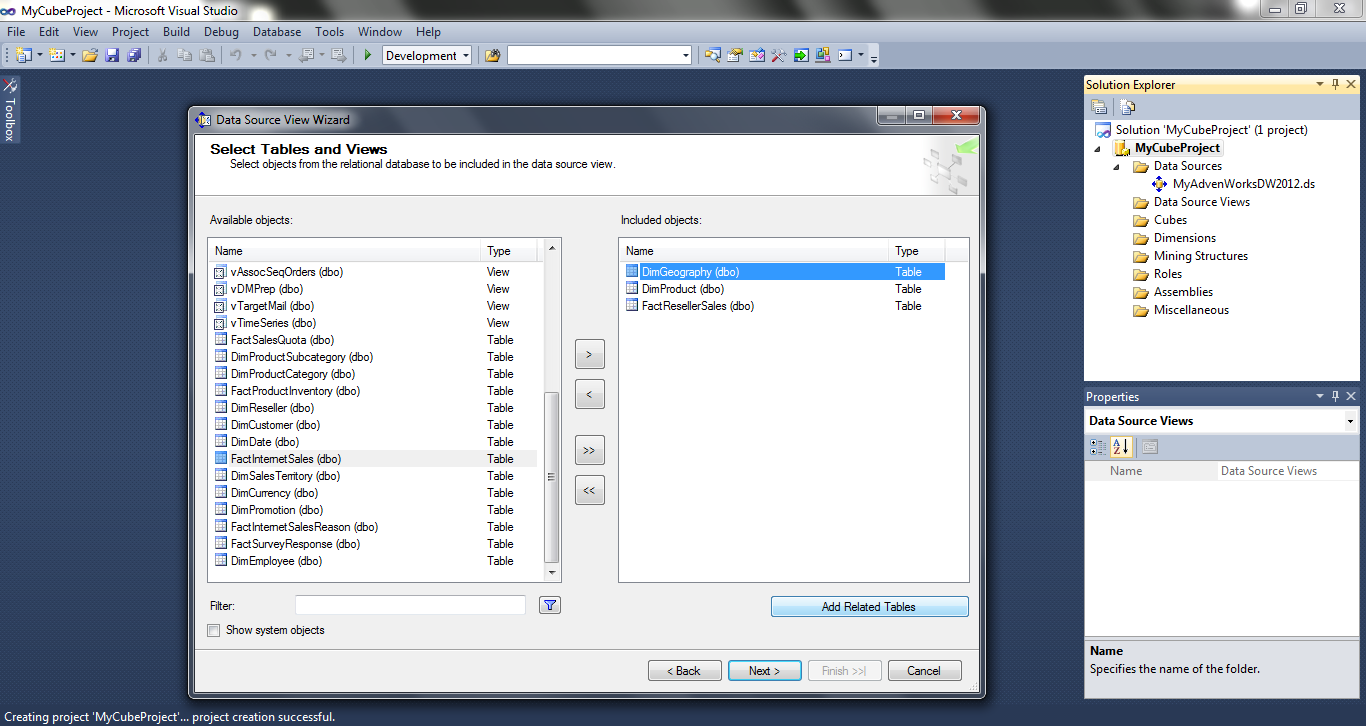
Select a particular table from the right and Click Add Related Tables button to pull all the tables related to it. Click Next.
Name the view and click Finish.
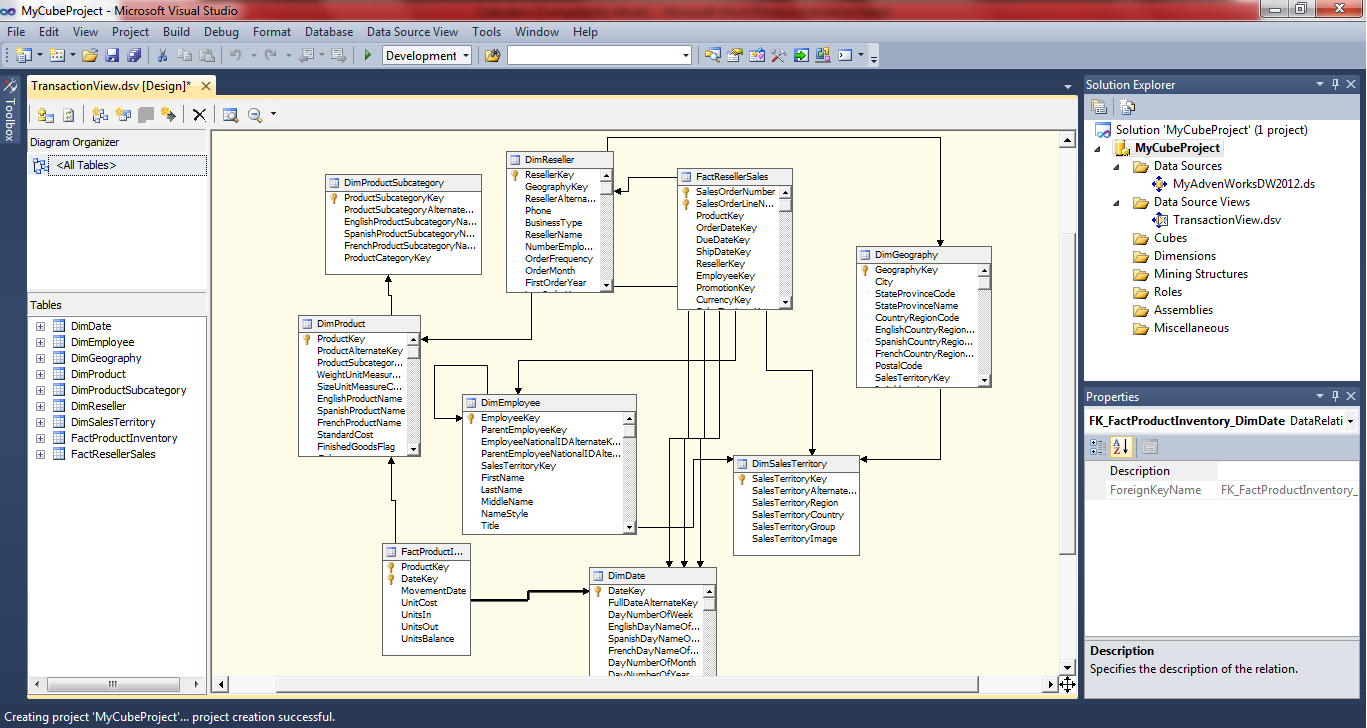
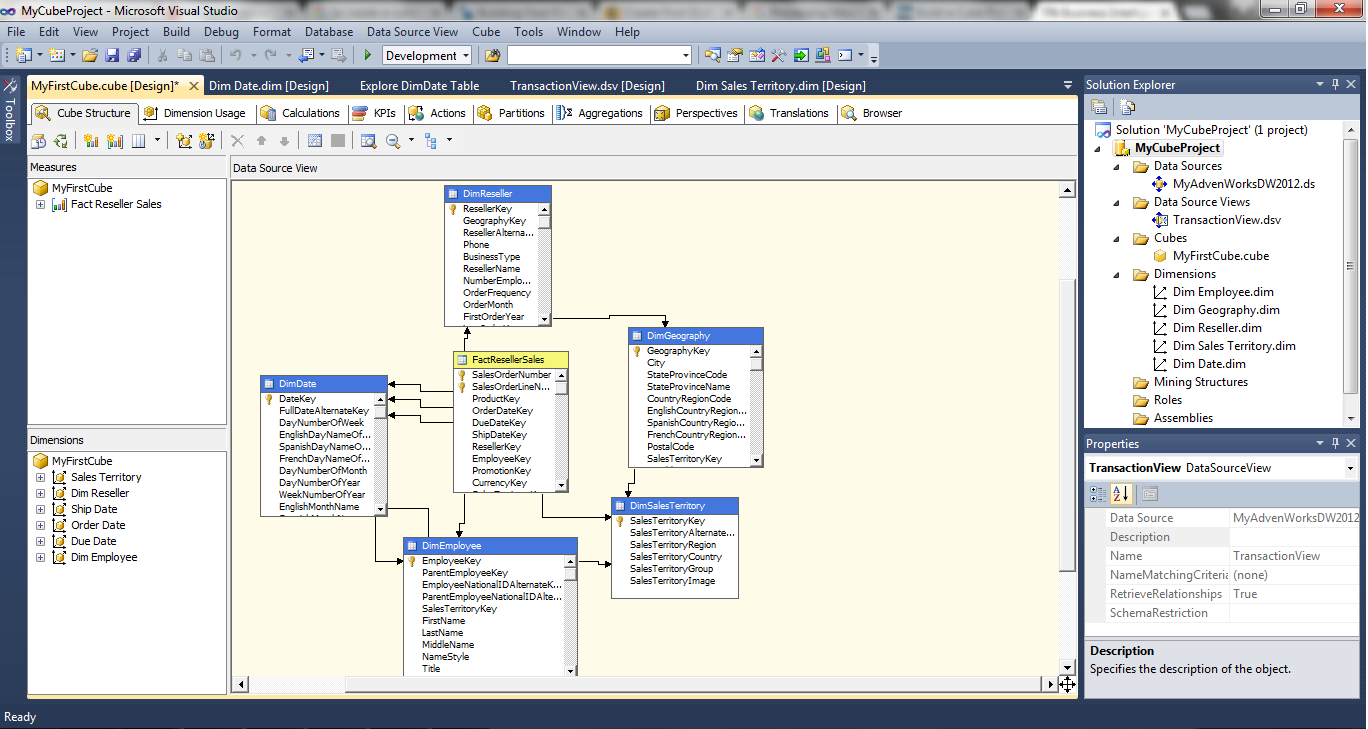
You will see the data source view as shown below. You can zoom it in or out to get a better view.
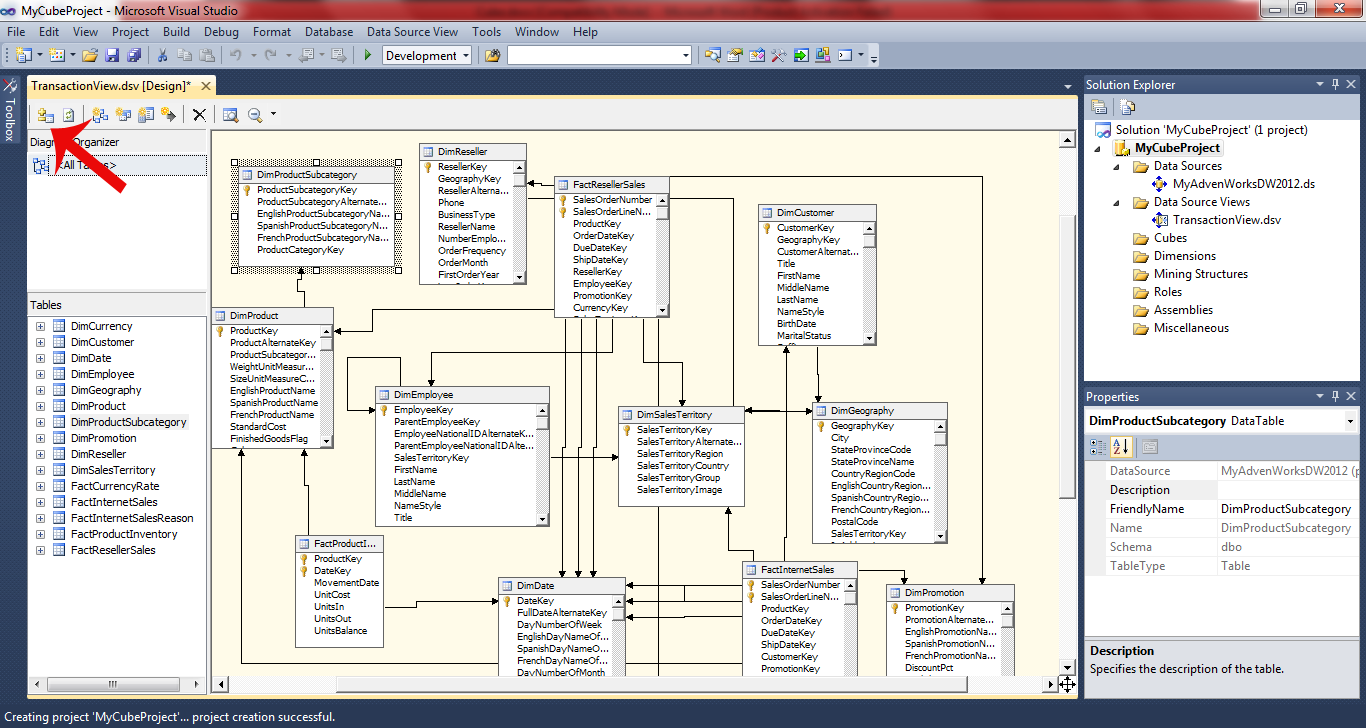
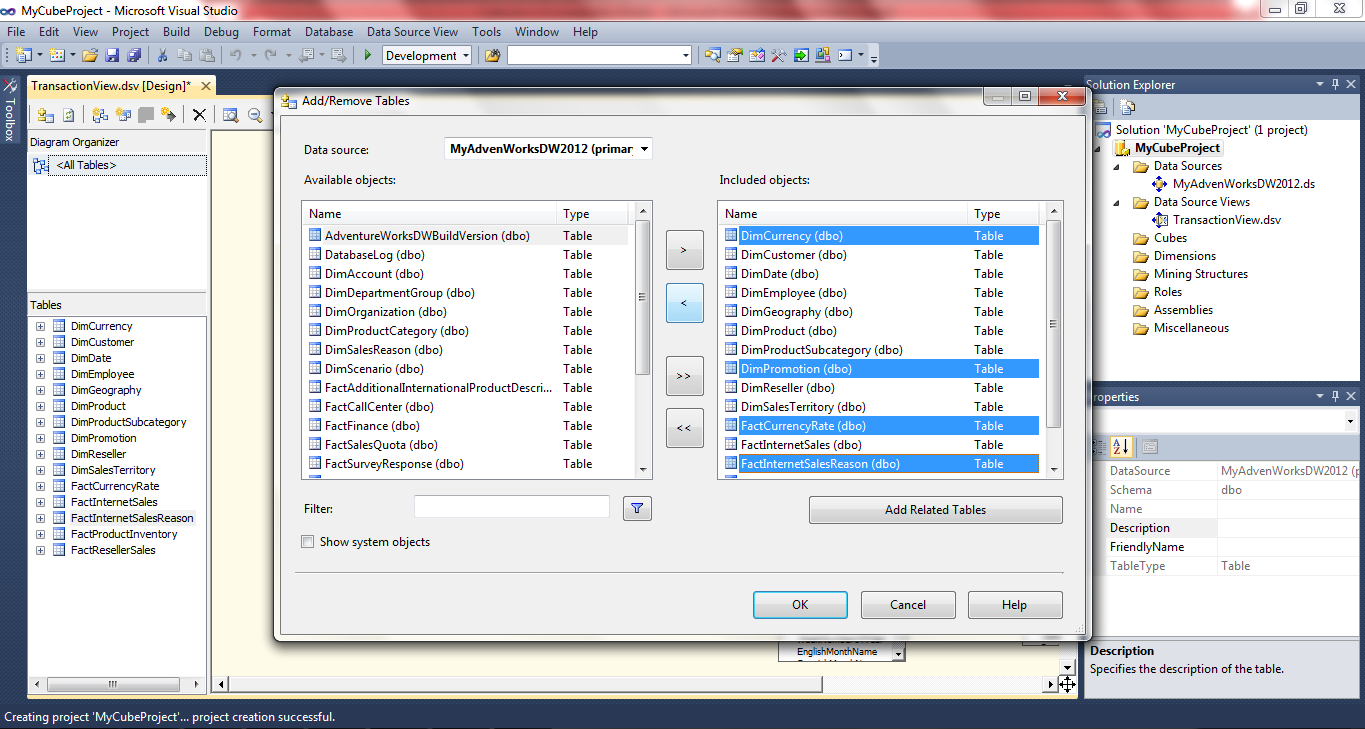
You can add/remove objects by clicking Add/remove objects button on the upper left hand side. Let me remove few objects DimCurrency, FactCurrencyRate, FactInternetSales, DimPromotion, and FactInternetSalesReason. For now, I may not need DimCustomer object, so let me remove it too.
After these modifications, Data Source View looks like this-
d) Creating Dimensions
You can create dimensions by following the cube wizard; however it is not a recommended approach to build a cube unless you are a fresher. Let’s create dimensions through the dimension wizard.
i) Create a Reseller Dimension
Go to the solution explorer pane, right click on the dimensions, and click on the New Dimension option.
Welcome page of the Dimension Wizard opens; Click Next.
On the Select Creation Method page, choose ‘Use an existing table’ option, Click Next.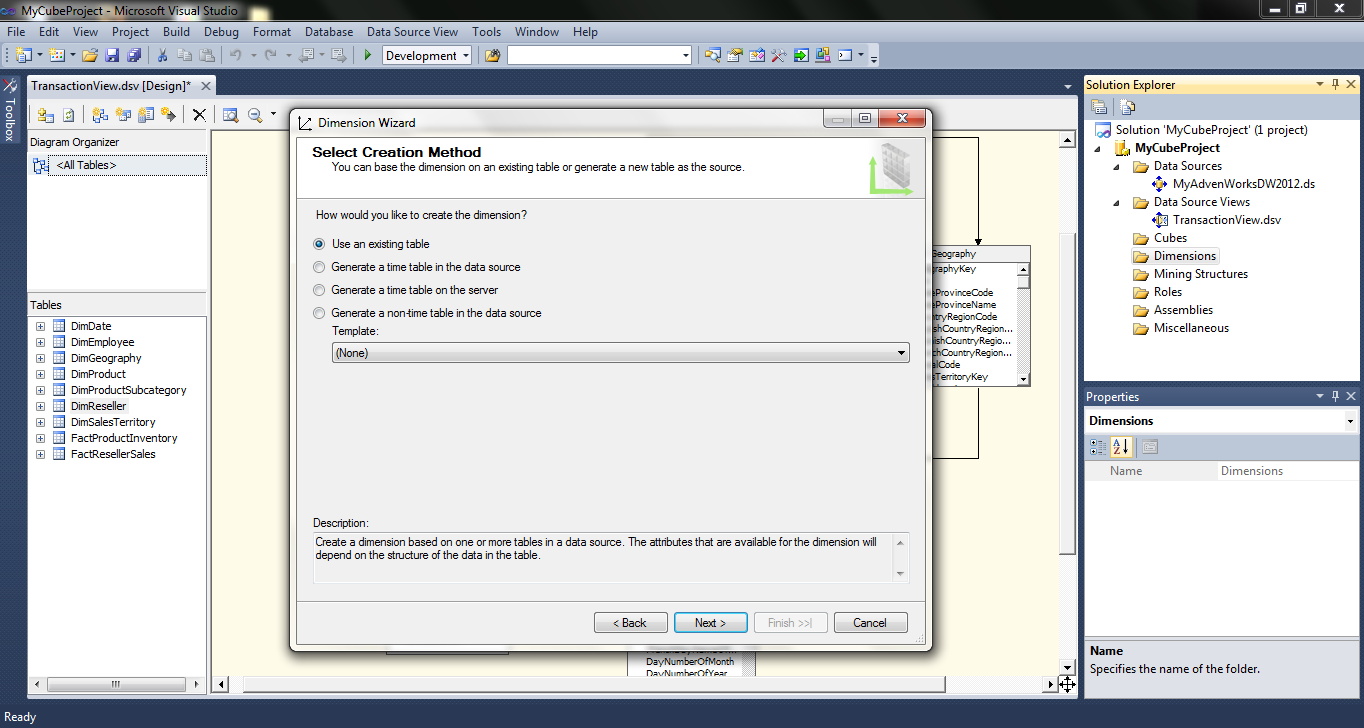
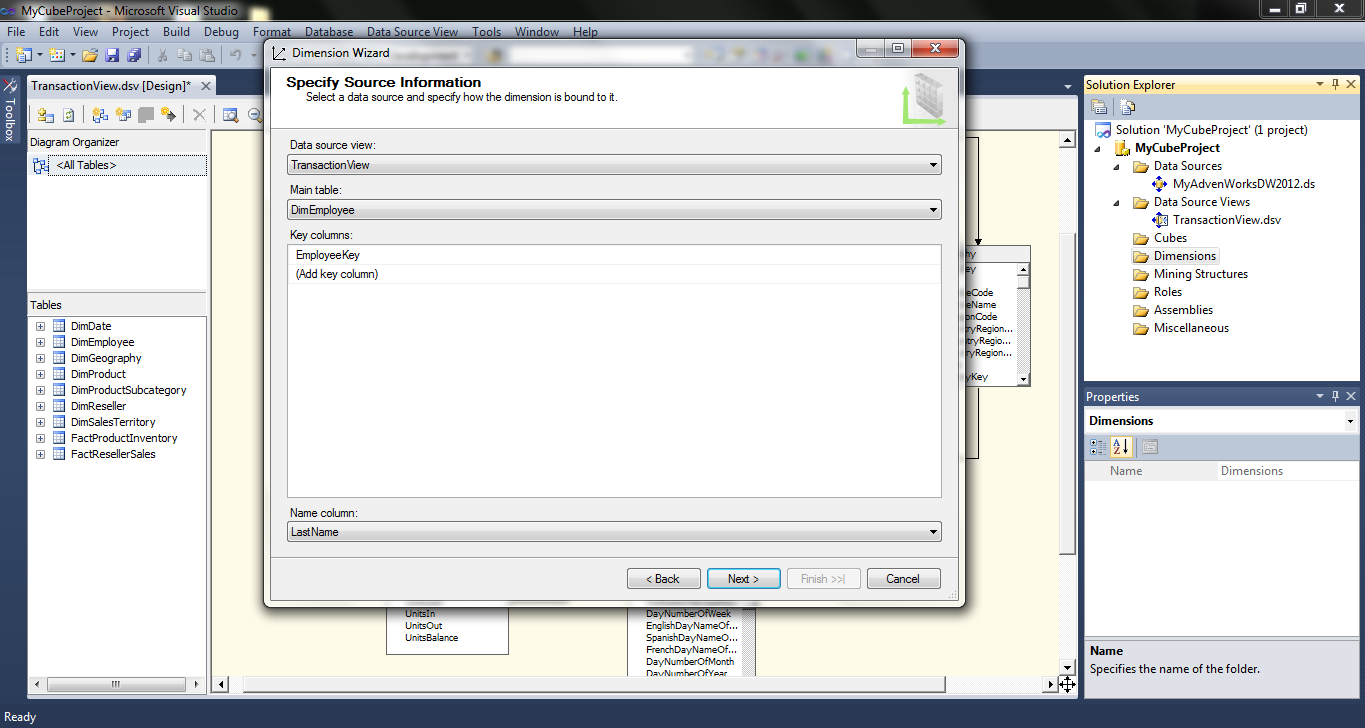
On the Specify Source Information page, specify data source view you are going to use, in my case, it is TransactionView. Choose DimEmployee as a main table; and LastName as a column name. Click Next to proceed.
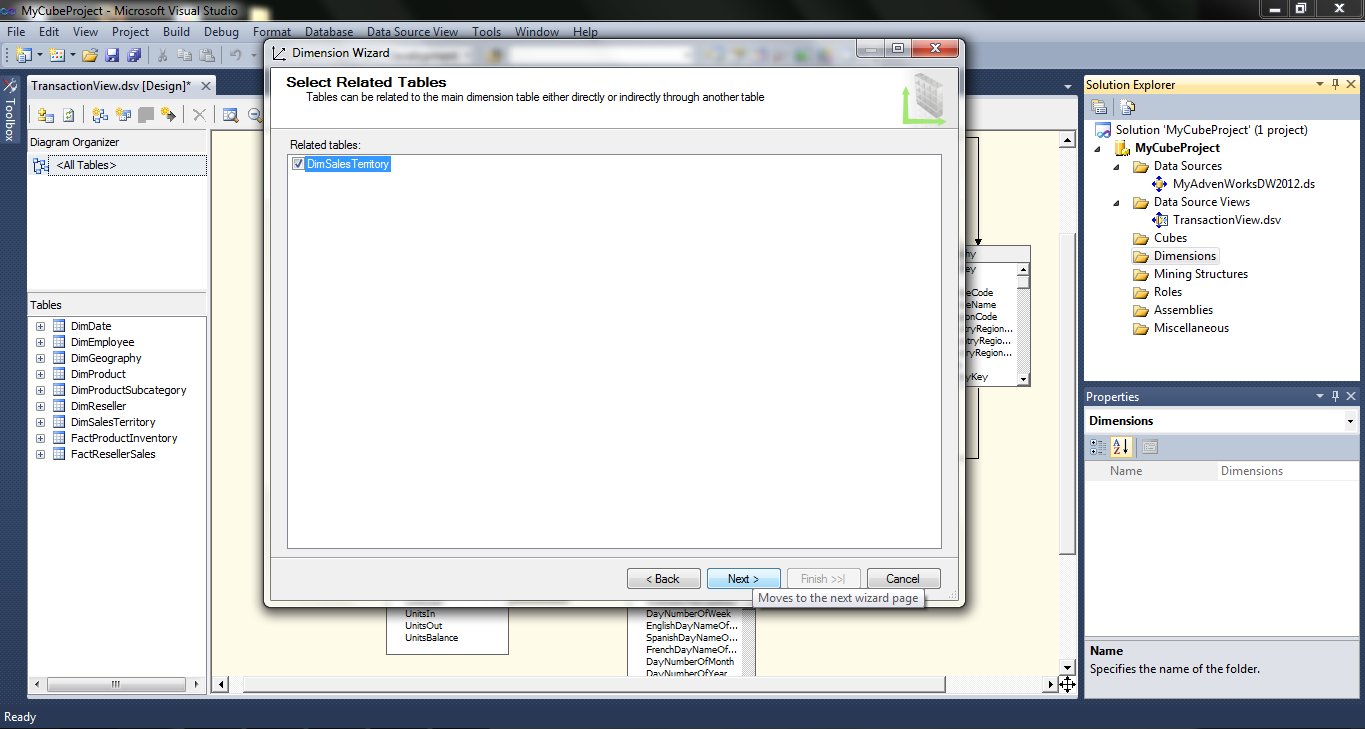
 You will see Select Related Tables page; check boxes against all the related tables and click Next.
Select the dimension attributes you want; click Next.
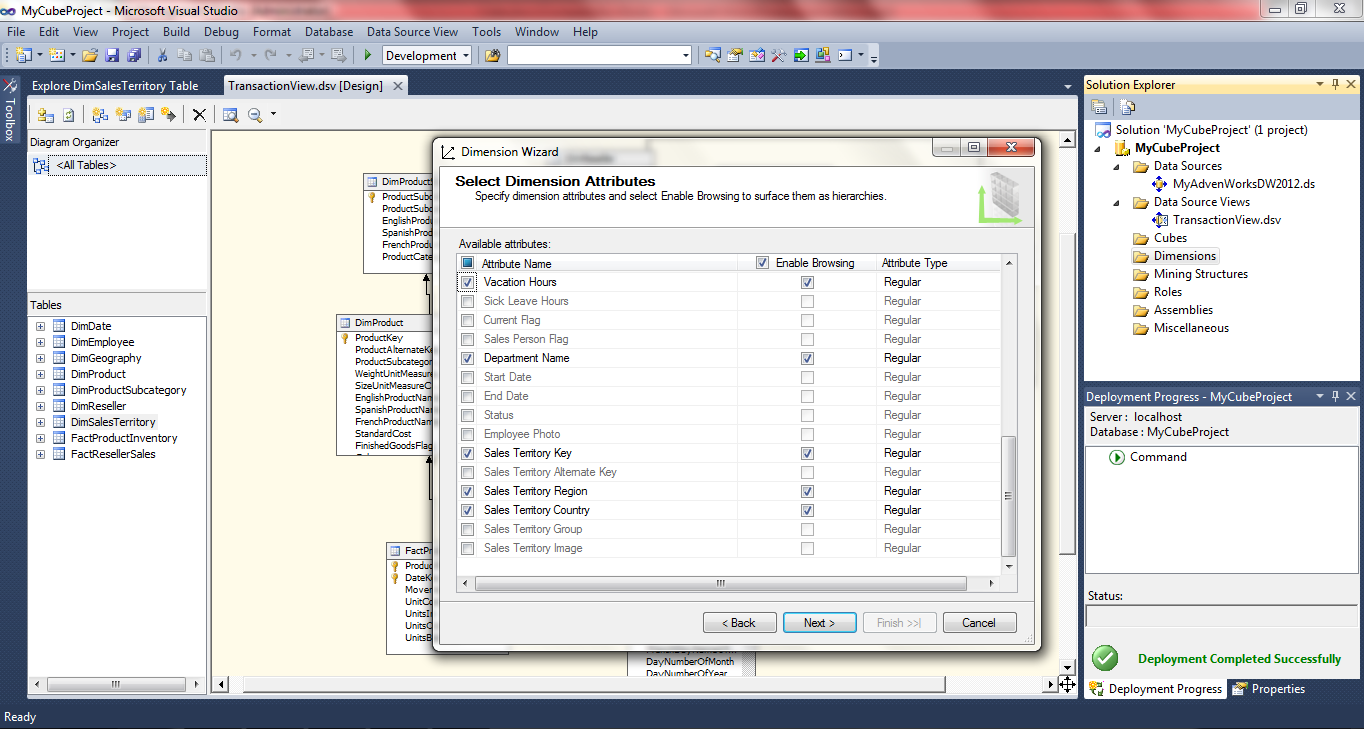
On the Completing the Wizard page, Name the dimension, or else you can keep the default one. Click Finish to close the wizard.
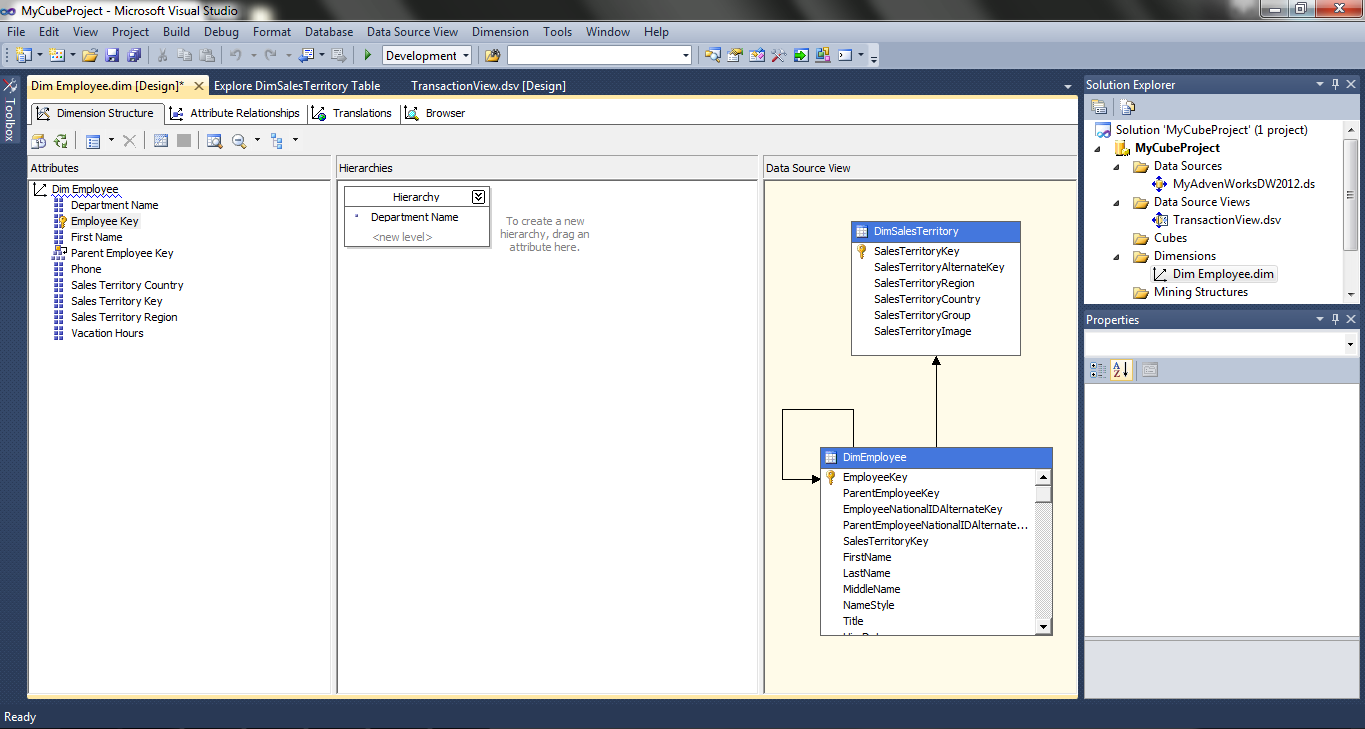
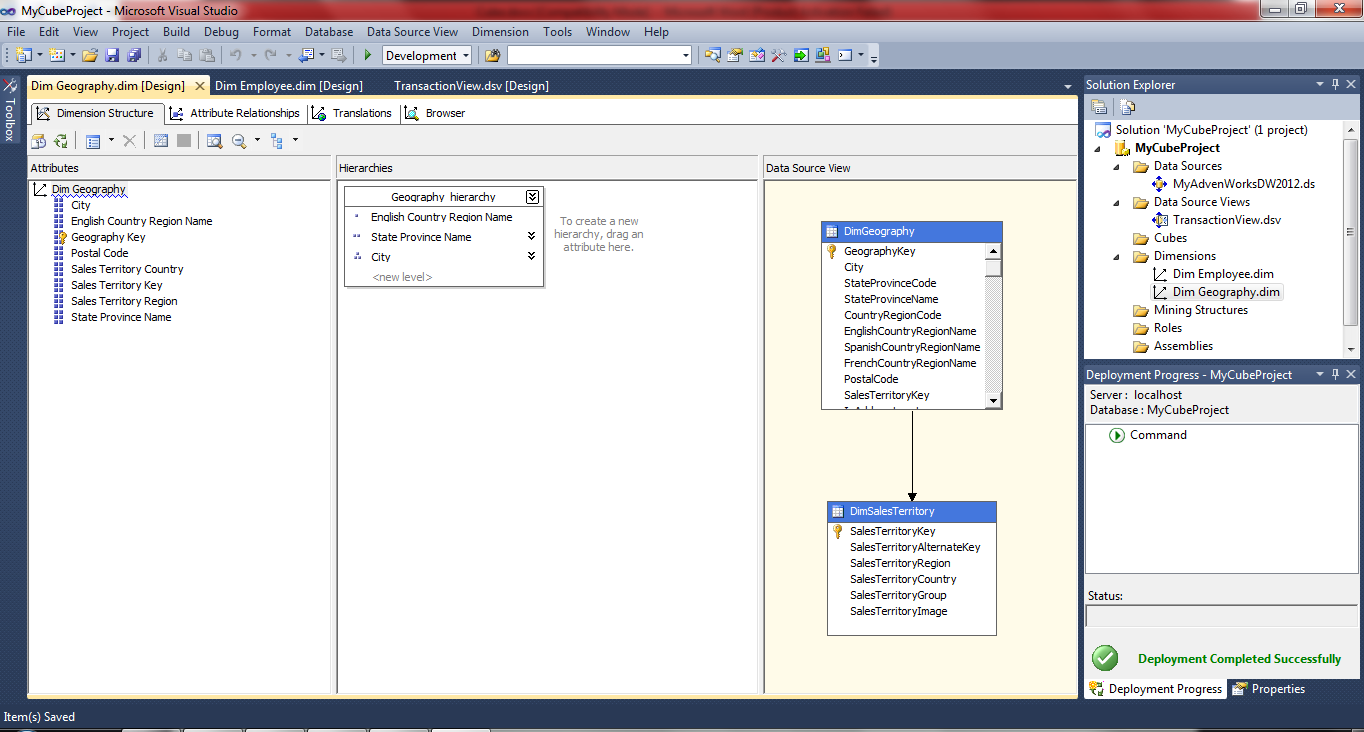
As it closes, you will come across a dimension designer page. It is divided into three panes namely, Attributes, Hierarchies, and Data Source View.
We can add hierarchies to the dimensions for the faster data access during query time. This is because, upon request, SSAS computes data and store aggregations in the permanent storage. So during query time, there is no need to sort/compute the data one more time, data is available readily. Through hierarchies we can navigate from more composite data to the detailed one. For example, Region –> Countries –> list of states –> cities.
To create a hierarchy object, drag an attribute from the Attributes pane and drop it to the hierarchy pane. Let me drag Department Name attribute and drop it to the hierarchy pane.
 Add another attribute, for example, “Employee Key” by dragging and dropping it to the <new level> right below the attribute just added, i.e. Department Name. You may come across a warning message – A performance problem may arise because attribute relationships are missing between one or more levels of the hierarchy. To resolve this issue, go to the Attribute Relationships page of the Dimension designer. By default, all the attributes are related to the key attribute. Reassign attribute relationships as shown below.
 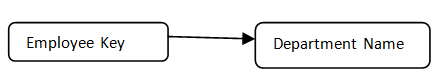 Right click on this hierarchy object; select Rename option to name the hierarchy object.
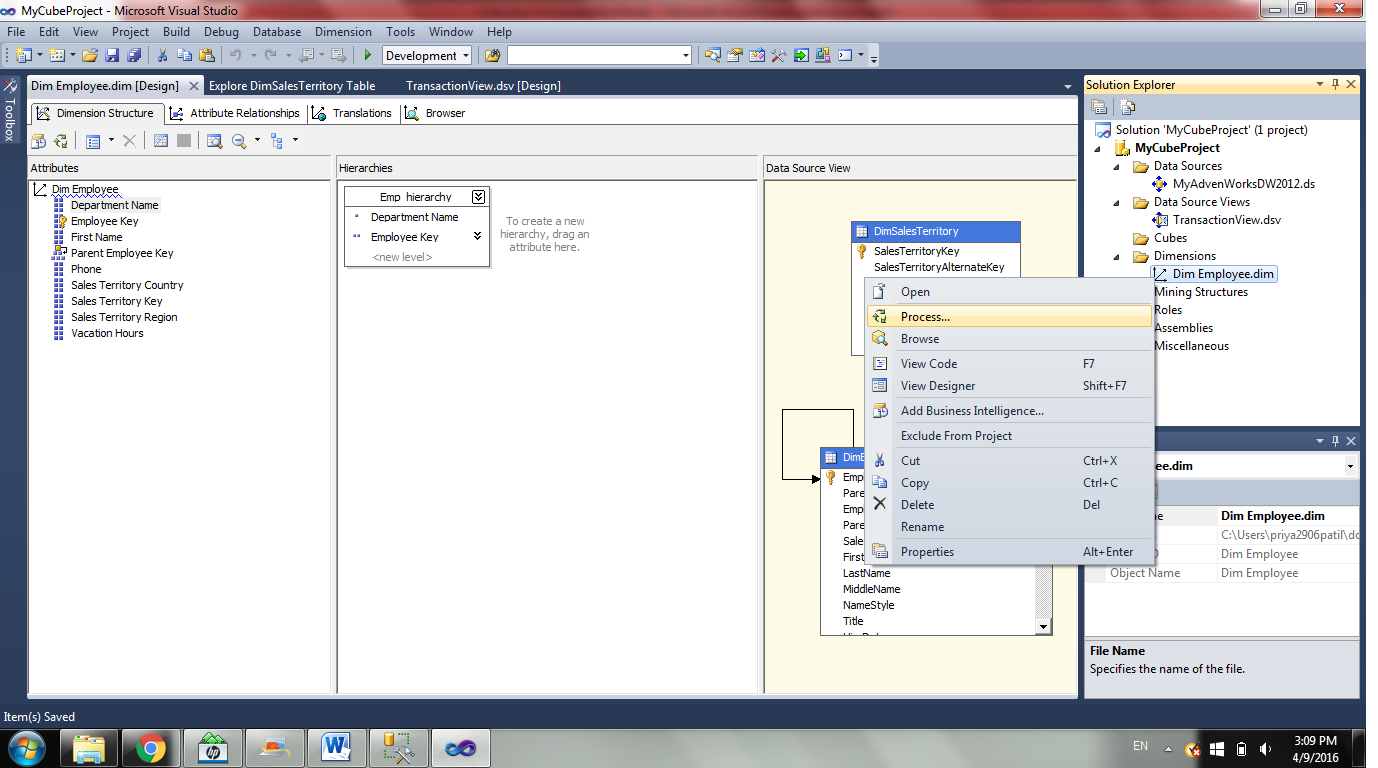
Now it’s a time to process the dimension. So right click on the DimEmployee dimension (under the Dimensions folder of solution explorer), Select Process.
Say Yes for the dialog box, and click Run button on the Process Dimension dialog box.
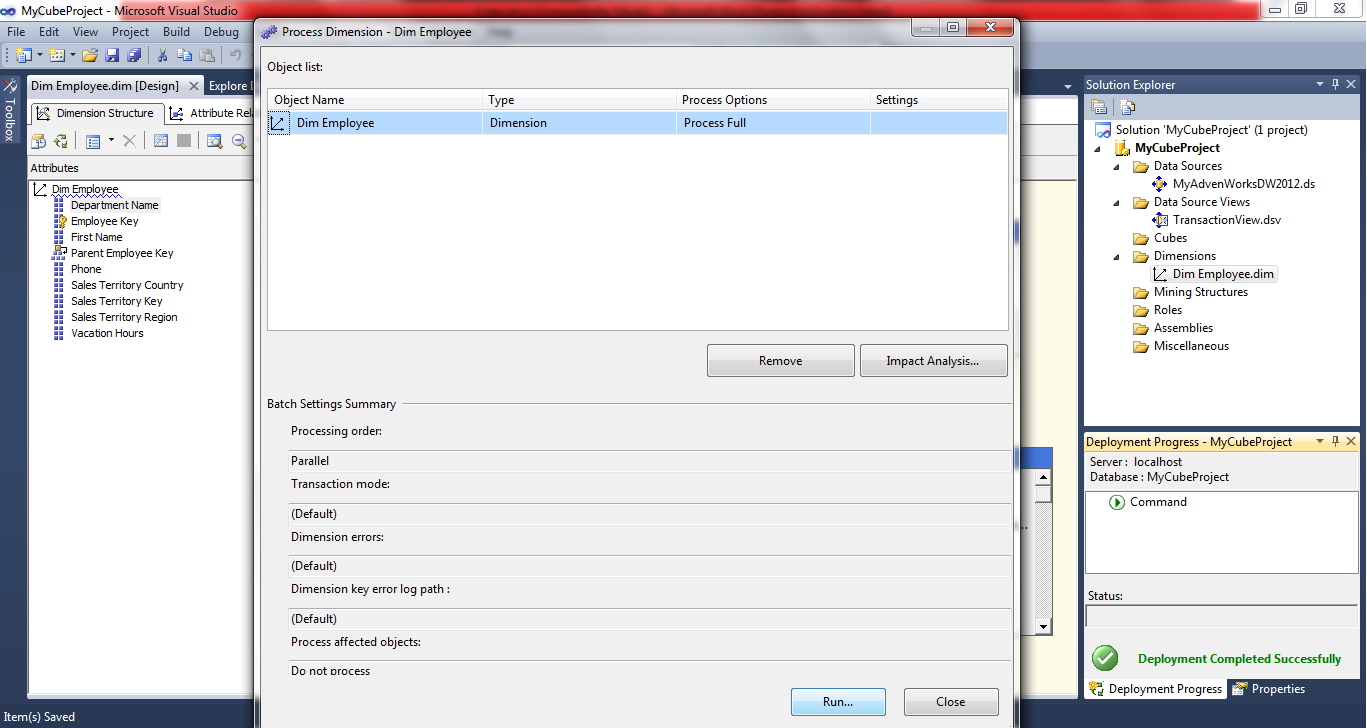
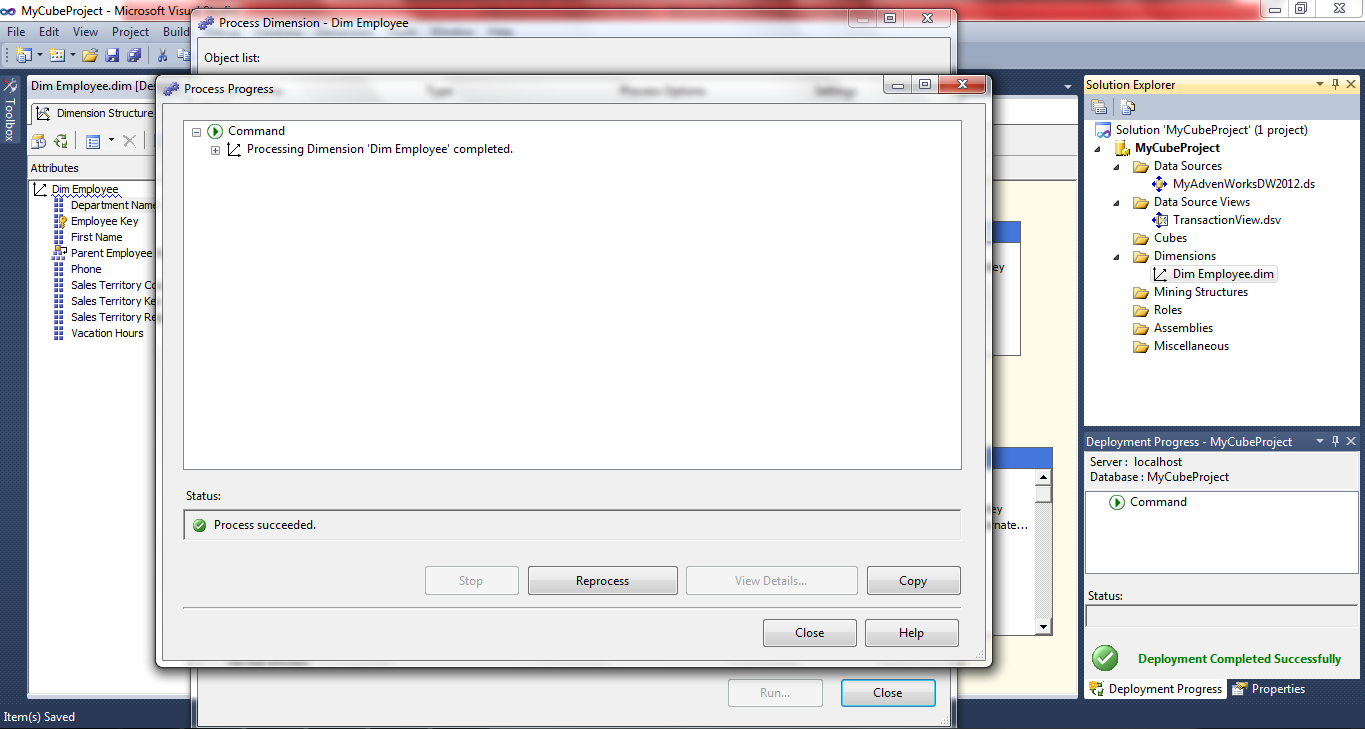
Process progress dialog box opens to show the status. Click Close twice to close Process progress and Process dimension dialogs.
Now, open the Browser tab, Select Emp_hierarchy option from the Hierarchy drop down.
Expand the tree by clicking on the “All” node to see the department names. You can further expand to see the employee first names working under a particular department.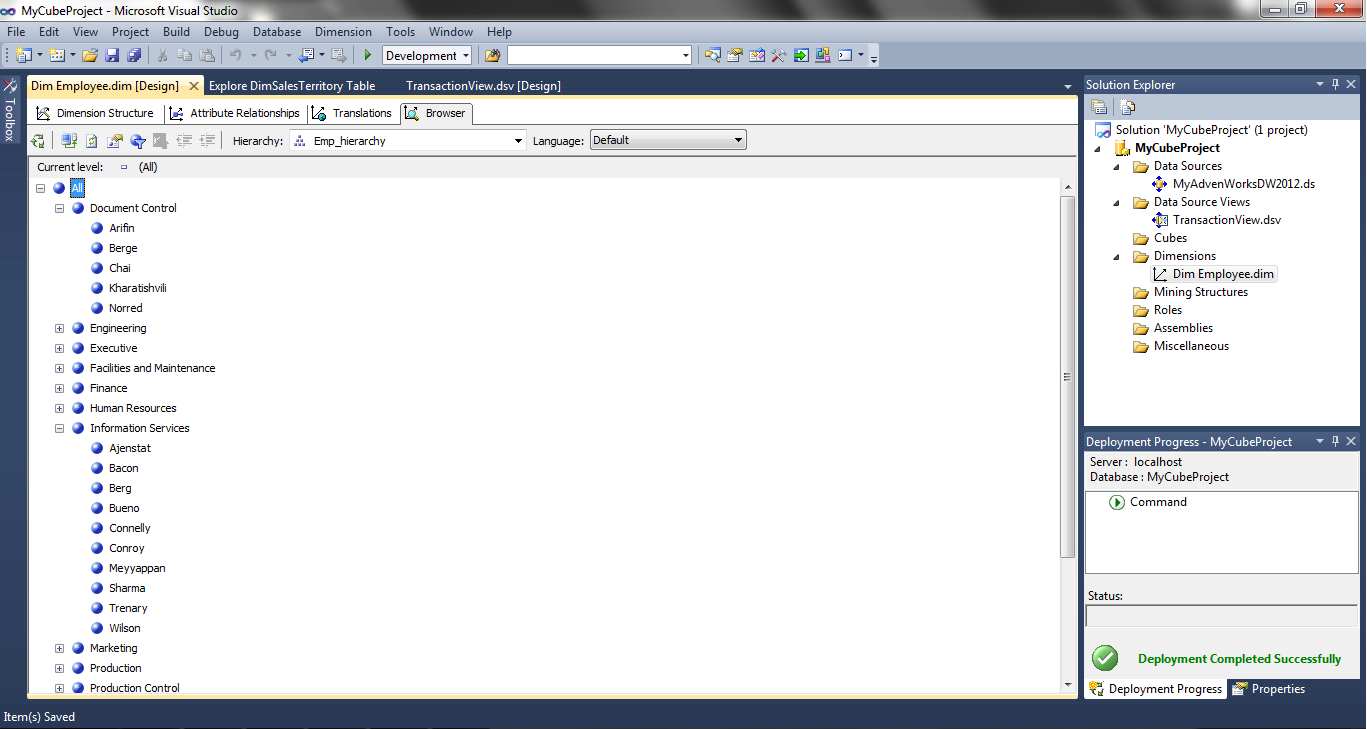
You can add as many hierarchy objects as you want for the same dimension.
ii) Let me create another dimension DimGeography. Follow the Dimension Wizard as explained above.
Click the Browser tab on the Design view of this newly created dimension. Expand the desired nodes of the hierarchy object Geography_hierarchy to get the detailed view.
iii) Create dimensions DimReseller, DimSalesTerritory; deploy and process both.
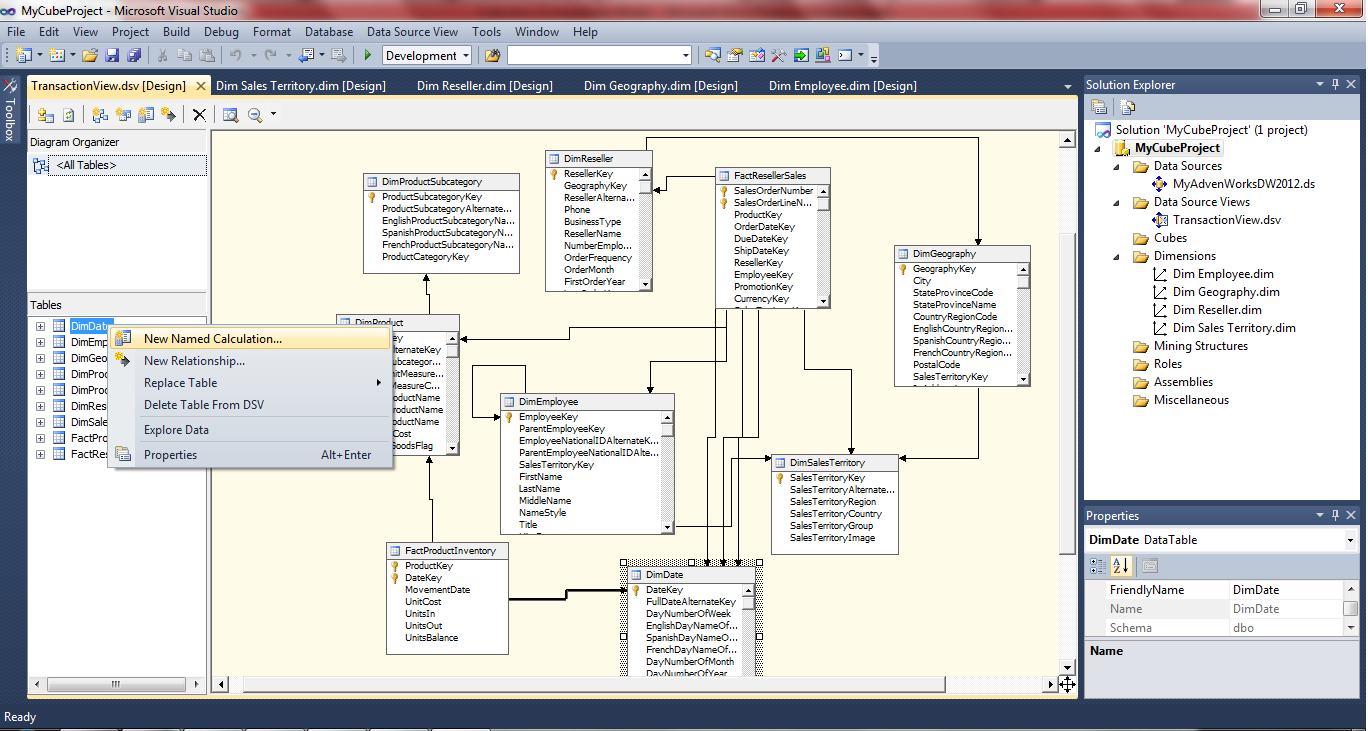
Before creating the Date dimension, let me add two named calculations to the DimDate table as the year column is not concatenated with the quarter and month columns. Right click on the Date table, select new named calculation.
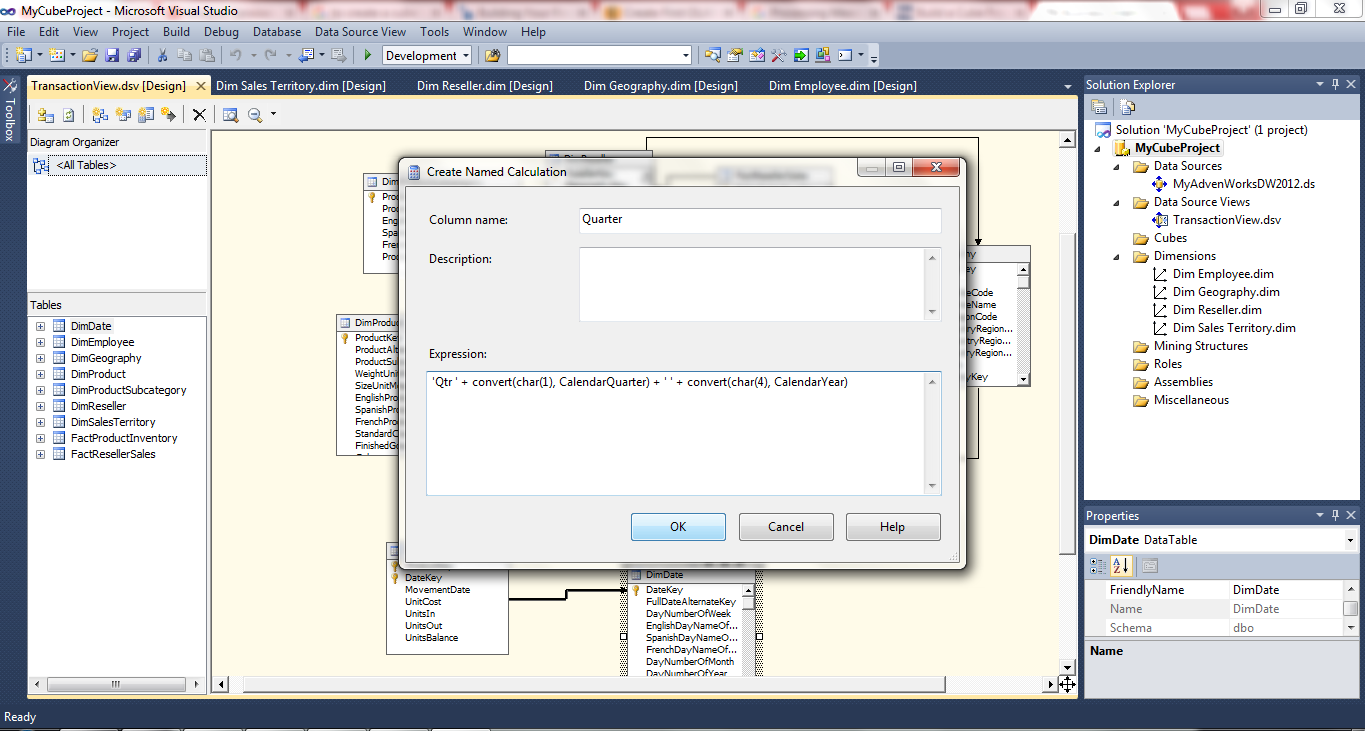
Enter the expression as shown below and click OK.
Now repeat the steps to add the named calculation for Month using expression:
left(EnglishMonthName, 3) + ‘ ‘ + convert(char(4), CalendarYear)
If you want to inspect the values of these newly added expressions, right Click on the DimDate table and select explore Data. Scroll all the way to the right and you can see the newly added columns, i.e. Month and Quarter.
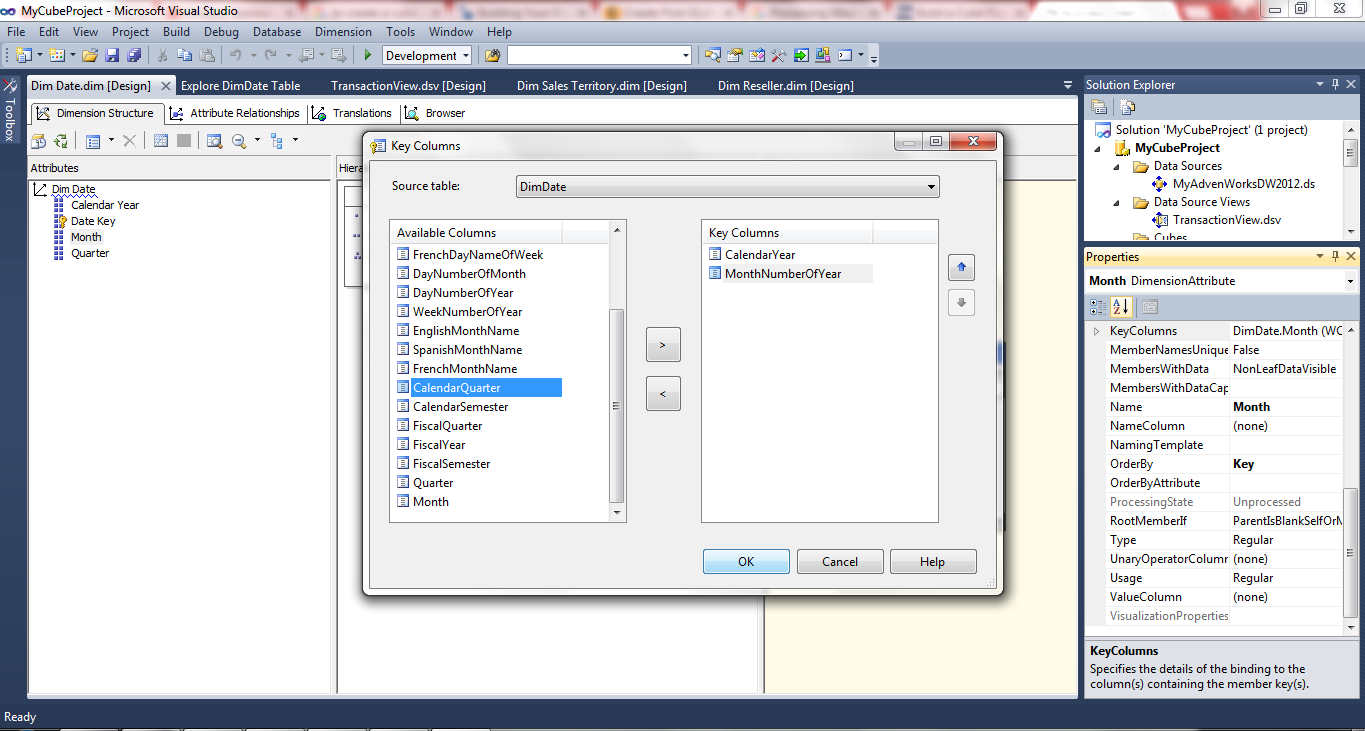
Now you can create the date dimension by following the Dimension Wizard. Update the KeyColumn Property for the month to sort it numerically rather than alphabetically.
Go to the properties window for the month attribute. Click on the ellipsis button of KeyColumn property. Key Columns dialog box opens. Select the columns as shown below; Click OK.
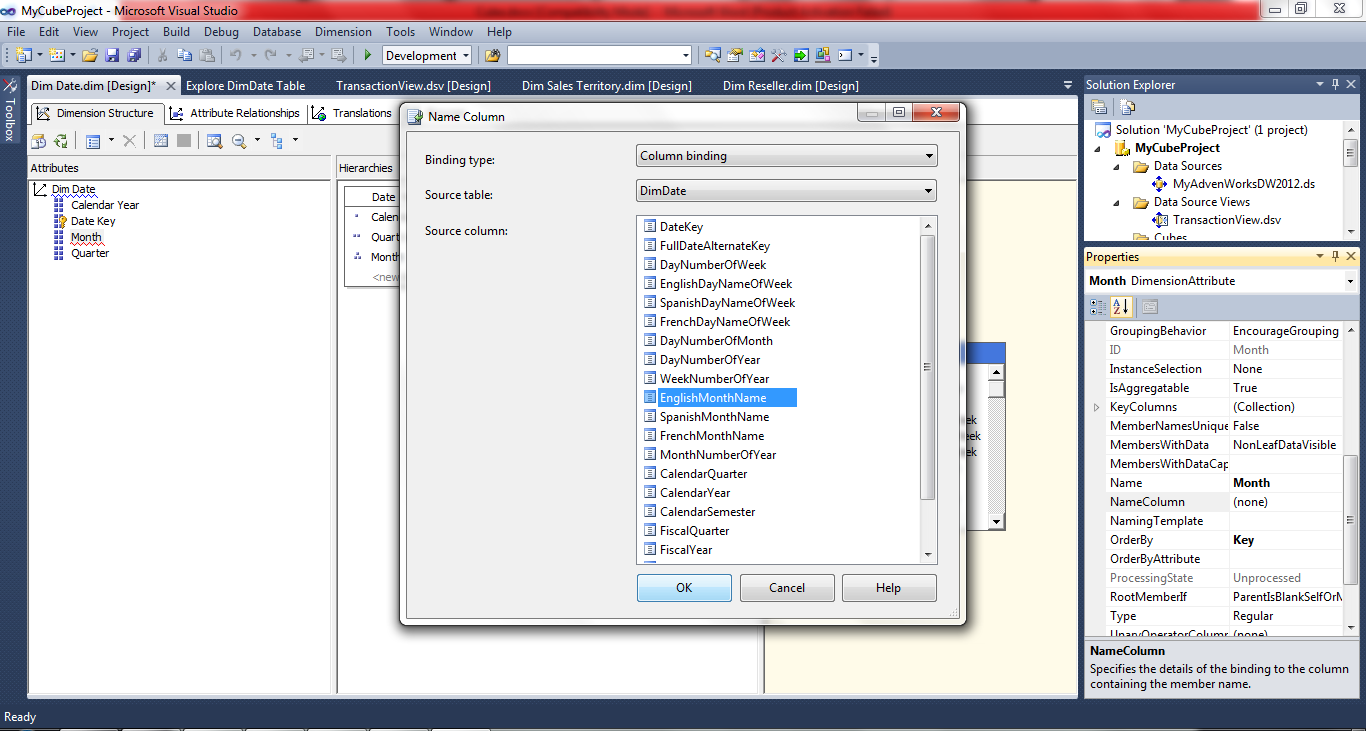
Now, assign a label to this attribute, by clicking on the ellipsis button of NameColumn property. Select EnglishMonthName and click OK.
Follow the same steps for the quarter attribute by setting its KeyColumns property to CalendarYear and CalendarQuarter. Also, set its NameColumn property to Quarter.
Finally, deploy the date dimension and process it.
e) Create cube
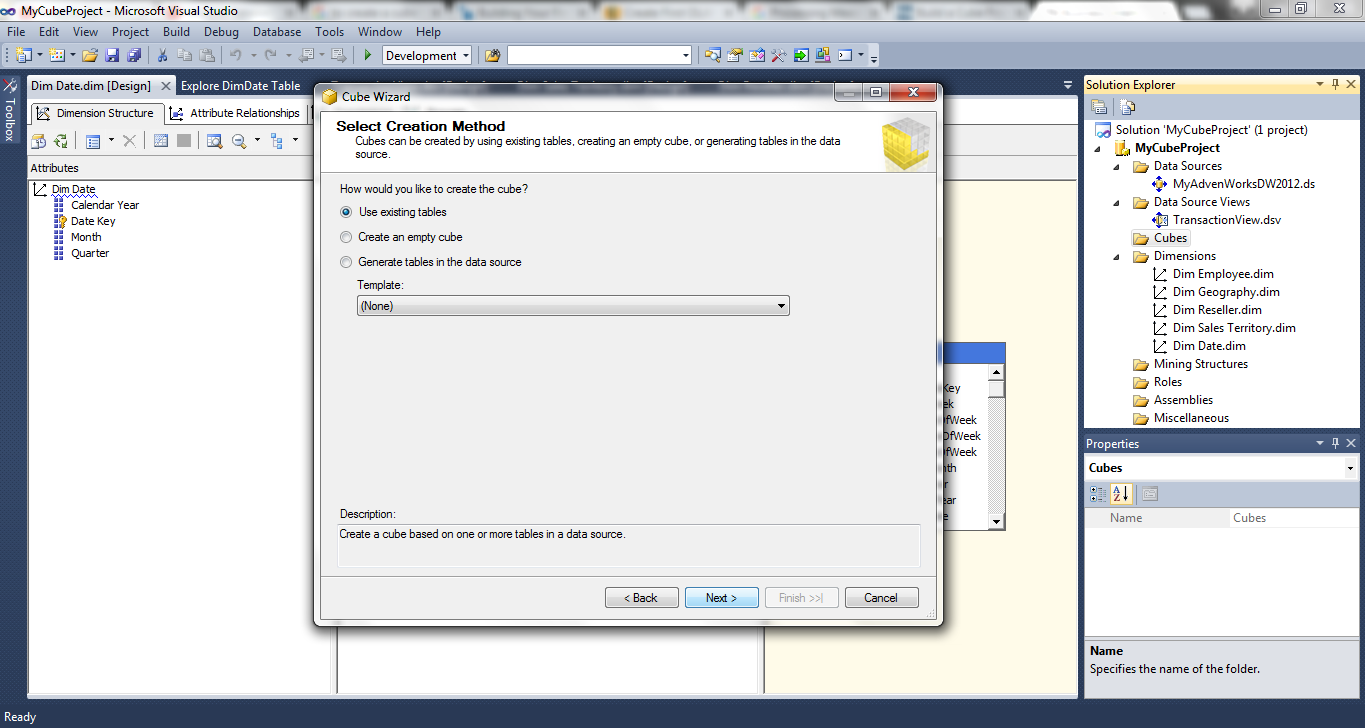
In the solution explorer, go to the Cubes folder and right click and select New Cube. It will open a Welcome page of Cube Wizard. Click Next to continue.
Select cube creation method. I will prefer the first option on this page. Click Next.
A measure is nothing but the column containing numeric values. All these measures are grouped by their underlying fact tables to form a measure group. For the selected data source view, let’s select at least one table that contains numeric data that you would like analyze. If you do not know which one to select, click on the Suggest button. Click Next.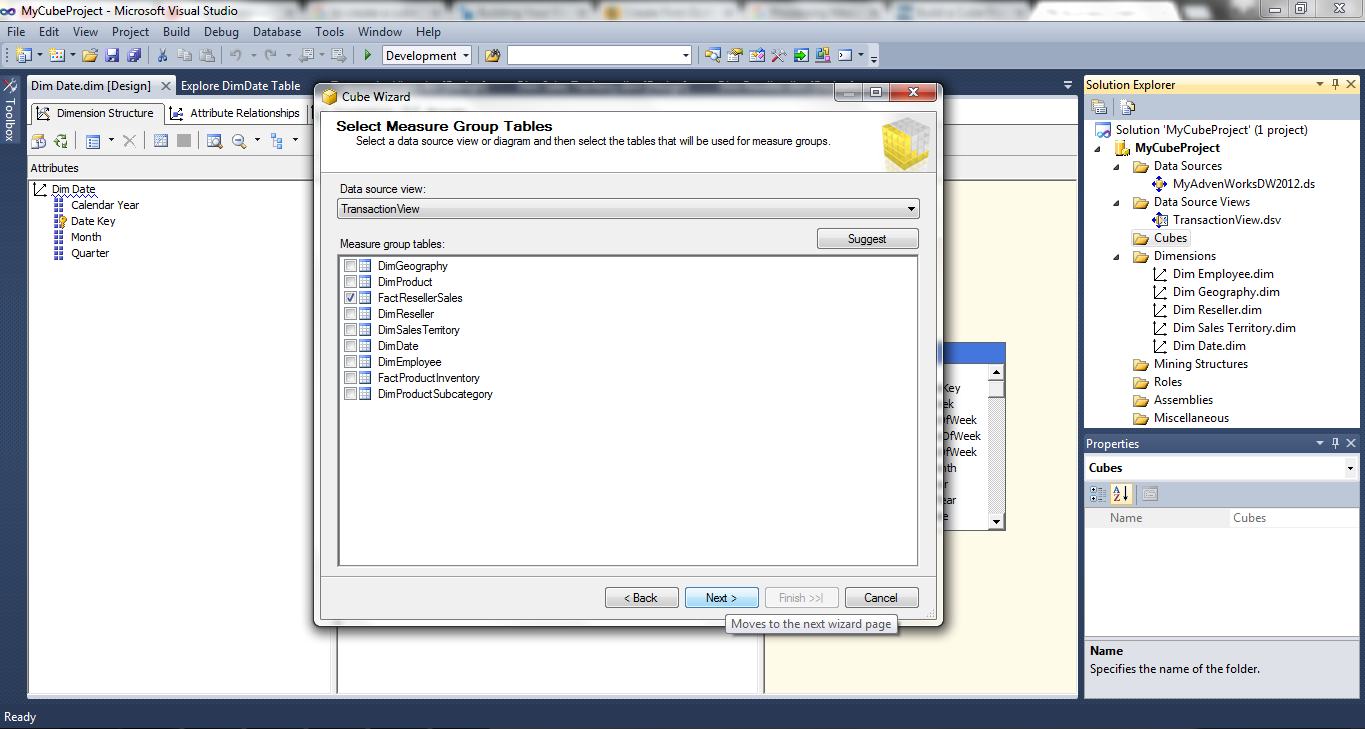
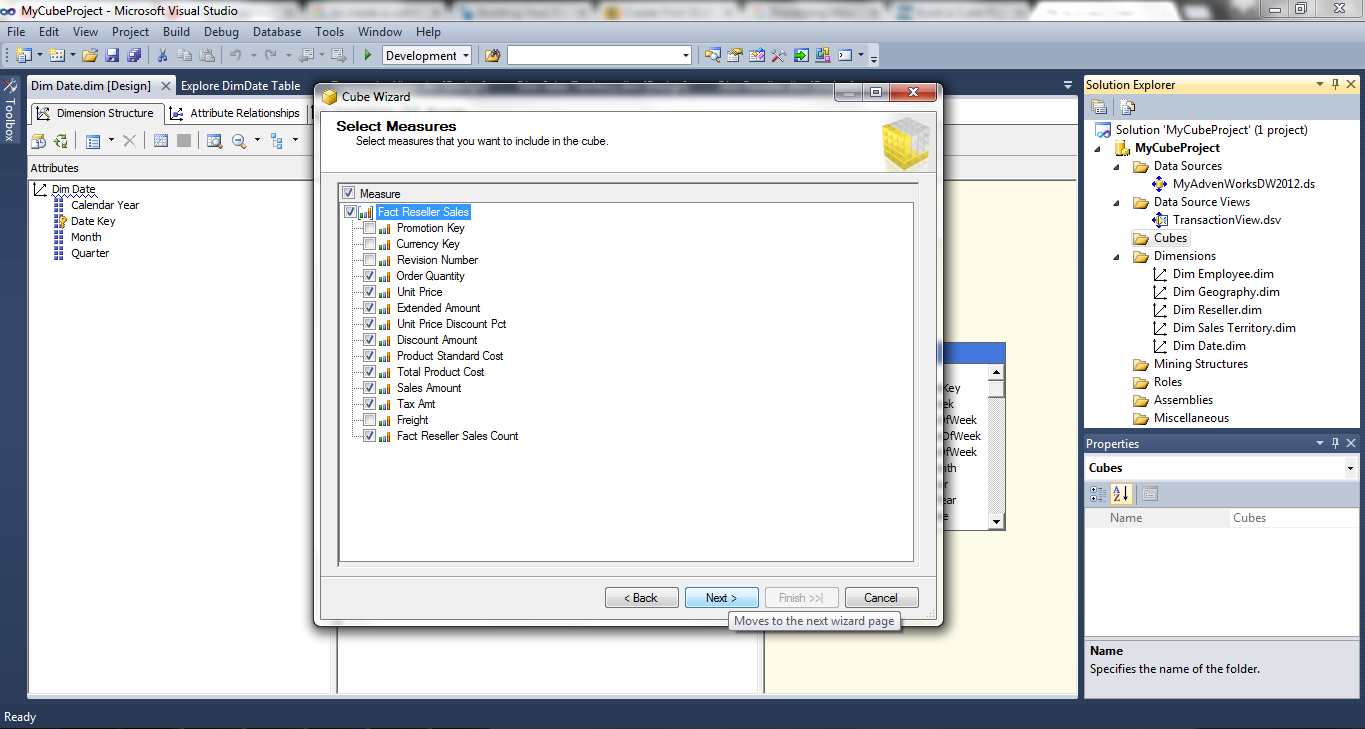
Select the desired measures. Click Next.
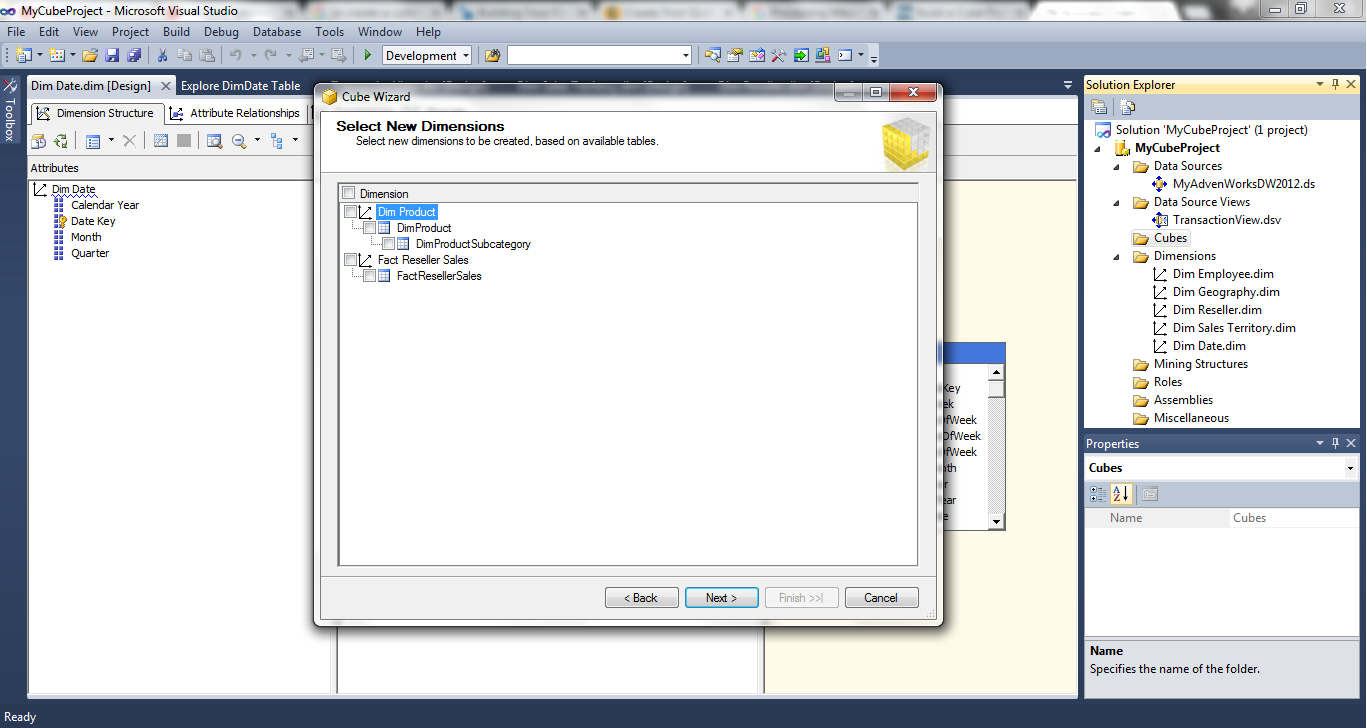
Select new dimensions if needed, go ahead and click Next.
On the Completing the wizard page, name the cube and click Finish.
Here is the cube design, not ready to be used unless we deploy and then process it.
e) Deploy Cube
To deploy the cube, right click on the MyFirstCube in the cube folder of the solution explorer, select Process, and click Yes.
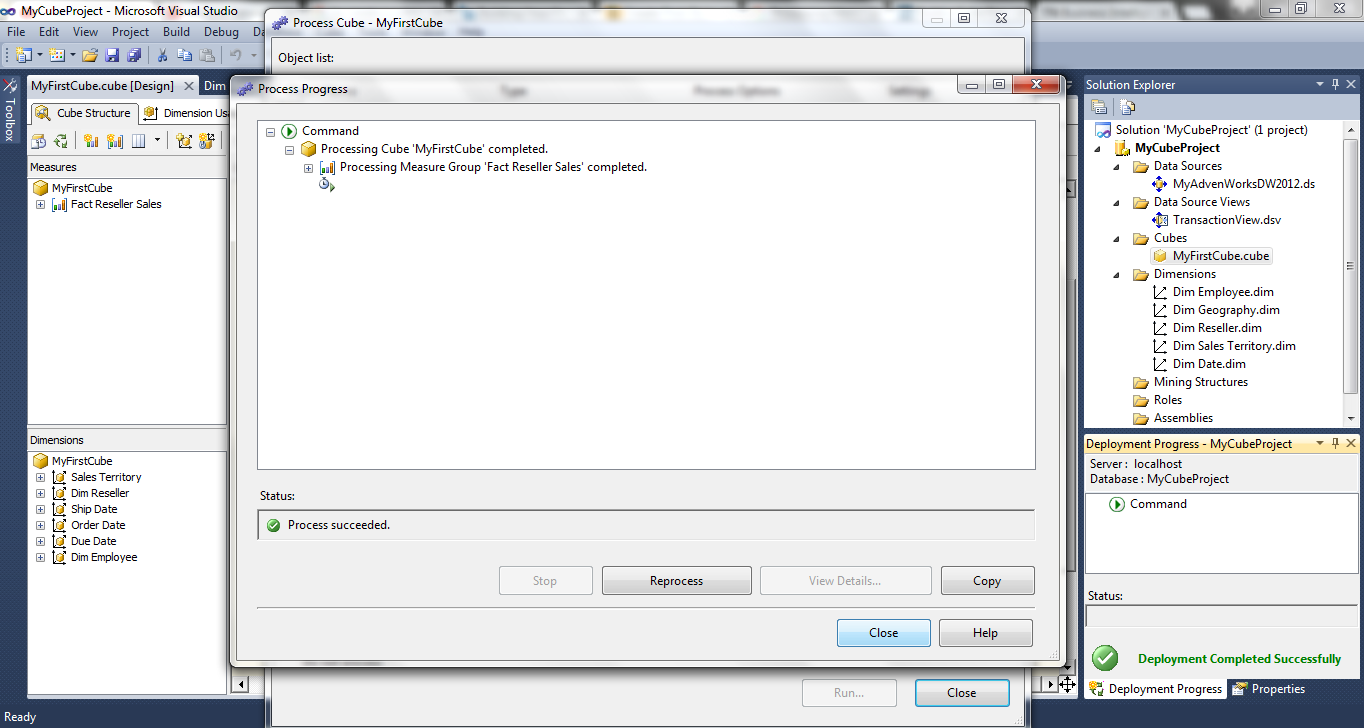
Click Run button on the Process Cube dialog box.
Process progress dialog box opens to show the status. Click Close twice to close Process progress and Process Cube dialogs.
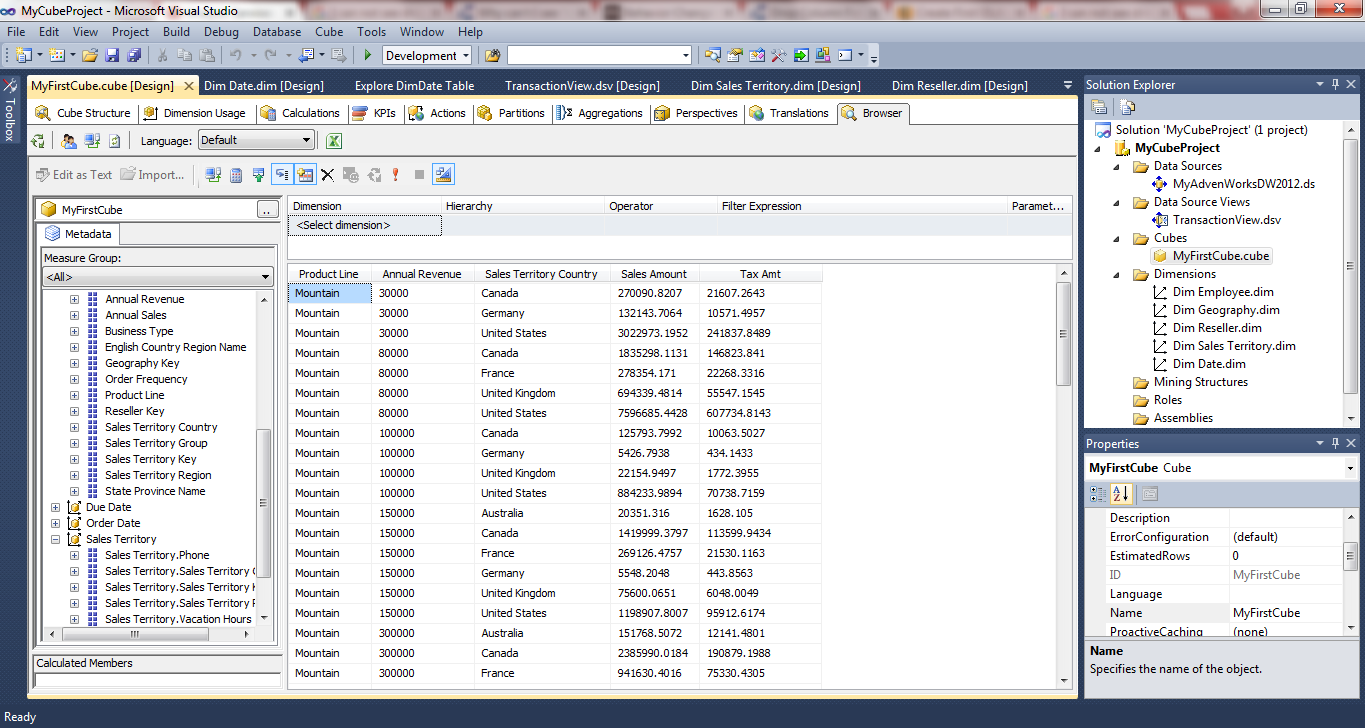
Open the Browser tab for the cube. You may see the multidimensional explorer for the cube. Drag and drop measures in the row fields or column fields as per the requirements. Get the multidimensional and comprehensible view of the data.
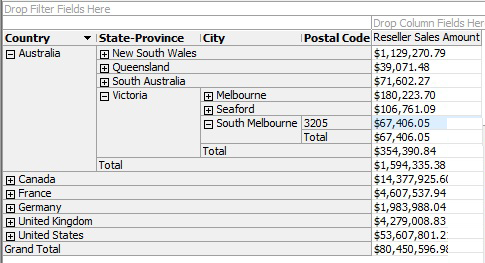
If the multidimensional explorer is not available, as in my case, you would be able to see only 2 dimensional data as shown below. In such cases, take help of Microsoft excel to explore the data using many dimensions at a time.
Conclusion:
OLAP cube has made the data analysis task simple, flexible, and less time consuming for the users of varying technical expertise. Cube design can be less complex and will acquire less storage space if we avoid adding dimensions that may not be required.
References : technet.microsoft.com/en-us/magazine/ee677579.aspx, youtube : Building your first cube from scratch